
Getting Up To Speed With High Performance Web
User Experience and tech meet in many areas in any given digital project. One of the most important cross-over areas is performance—an area often not getting its share of time and love, but always made visible when it is lacking (= poor). If you are a business analyst, developer, or designer doing web projects in 2018, take the pledge to never make sucky, slow sites or apps again. High performance is no longer the result of magic recipes, but a prerequisite for web today. Let me show you ways of going faster with a whole lot less headache than you might imagine, regardless of which of the previous categories you belong to.
Note: This is a rather lengthy article taking up a lot of angles on this issue. If you want a short list of things to cross off your list, scroll to the bottom section titled The top 5 things you should do right now.
Performance is both the cool kid on the block as well as the poor bastard that doesn’t even get scraps from the table. I’m here to show why performance is paramount on the web today and how you can make things much better with very little. You know. Like McGyver?

Let me be straight with you: You can typically make your site significantly faster with no formal, manual, slow refactoring of source code. In fact, it is unlikely you will gain more than a rather small share of your possible improvements by doing such work. No bullshit! Though you will probably gain run-time performance improvements, which is somewhat outside of this article’s scope. Instead opt for improvements in reducing asset sizes, specifying modern delivery formats, taking control of loading order, and packaging your JS/CSS with a build tool.
In line with my own work and front-end interests in performance, I’ve created Hiperf which is a high performance architecture based on Webpack. Architecture because it’s not about Webpack+Fancy Framework, but more about giving a solid, fast, production-ready Webpack setup you should be able to drop most anything into, plus an HTML boilerplate with examples of pretty good usages of modern patterns for loading, doing images, etc. The focus here is ultimately on “fast”. Hiperf is meant to relieve you of the most time-consuming work when setting up a new project, or migrating an old project to a new technical standard. It’s a natural progression of my own boilerplates and structural work, both working freelance, as a designer, and as a consultant front-end developer.
hiperf - Hiperf is a high performance web development architecture based on Webpack - just apply your framework.github.com
And nope, this article is not just a marketing plug for it :) More than just mincing on about my own work, this article is meant to offer an overview of good front-end performance practices, most of which Hiperf comes with out-of-the-box. The rest of this article will go on to explain some of the mindset, patterns, methods and tools that can give you great leverage for (mostly) low effort.
Sharing the love
Before beginning, I want to give a shout-out to two resources I highly recommend in this area. The ultimate front-end performance list is probably the one written by Vitaly Friedman over at Smashing Magazine. It is updated yearly and is an absolute treasure.
Performance matters — we all know it. However, do we actually always know what our performance bottlenecks exactly are…www.smashingmagazine.com
If you want to have something a bit more interactive and tool-like, there is also the Front-End Checklist. Super nice for visually seeing concrete “tasks” to implement, as well as just providing a good number of suggestions on things to work on.
🗂 The Front-End Checklist Application is perfect for modern websites and meticulous developers! Follow the rules and…frontendchecklist.io
OK, let’s get to it. So:
Why is it so hard to just make a fast-loading site or web app?
Frankly, this should not be a big deal. Yet, it seems it is. If for nothing else, then because it’s super important for the end-user. I’ve seen performance be considered a “luxury” by other developers as well as a concrete, isolated “feature” by product owners. Unfortunately, by developers—who are the closest in line to create a fast web—performance is sometimes seen as something both mysterious (alien, distant, unreachable) and a very clear sign signalling one’s shortcomings. Otherwise the PageSpeed stats wouldn’t suck, right? Most people seem to find an objective mindset such as kaizen or continuous improvement really hard to get into, as those require one to have a solid understanding of what is happening, why that happened, and why it is not working. The psychological reality of accepting failure—to be quite blunt about it, some form of “failure” is what is implied in bad stats—meets with the dreaded capital B “Business” and the raw economics of doing development. For the hobbyist, performance is usually not the number one priority when spending one’s evening hours on a side project: Numbers are cool, but just don’t make much meaningful sense when it’s not the solitary focus. And for the professional day-to-day developer the churn of tasks and time budgets will seldom regard such infrastructural issues as tooling, nor testing the ideal way of processing assets or configuring server settings. Let’s be real:
Getting to A+, class-leading performance should not be your goal and is probably not feasible, regardless if you work for yourself or act as the boss of a crack team of developers. What truly matters is doing your due diligence—which any statistics of website size and loading times should make clear is not done by all of us.
Why performance is a big deal
Just plopping in the latest and greatest something-or-other and tons of still-bleeding edge markup will indeed likely increase your web performance. But! As with everything in development, laying a solid foundation and having a deep-rooted culture will make that first hillclimb into a more flowing, continual journey devoid of impassable trenches and mountains. At least four four dimensions are concretely influenced by performance:
1. Economics and The Competition
For Amazon, already a 1 second slower loading time could mean $1.6b in losses. That number is from 2012 — imagine the astronomical amount the loss would be today! What does such metrics mean for your business, or for your client? Increasing performance has a history of increasing conversion (among other things). Even small things do mean a lot here! Make it easy and snappy for users to engage (buy, interact, socialize…) on your site. Even if your project/business/client won’t make a million bucks by a 1% increase in sales or users because of faster loading, it does makes business sense to present the site/app as beautifully, functional, responsive and performant as possible. Not one or the other—all of those together. Metaphor: Don’t be a well-dressed ape at a dinner party.
Lesson to be learned: Don’t let people wait to do things they expect should be as fast and easy as somewhere else. You will be judged by a plethora of criteria, all of which change based on the market and general field you’re in. Knowing all of those criteria is extremely challenging. One thing that won’t change, however, is performance—both absolute speed as well as user-perceived performance. There is zero room to perform objectively worse than your competitors or other sites/apps in general. You, your site, your project/business/client — none of them is an island, for better or worse.
2. User/Customer Experience + Brand Equity
With that said: What does it cost your user? Personally I’ve been working on a few sites which cost $0.5–$1 (Canadian dollars) just to open at all. And these are nowhere near the mammoth sites which developers troll on Twitter. A pretty common data plan for cell phones is 2GB of data. While bandwidth might be virtually limitless on corporate Wifi or on your own gigabit broadband, when you’re out and about browsing on the bus, that overpriced, tiny data plan will tend to burn up faster rather than later. Where did all that data go?!
Well, with the average site today hogging about 3MB, casual browsing can turn into an expensive pastime. Especially considering most of a site’s given assets aren’t even used, and that they are often entirely uncompressed.
Here, inefficiency is really the core experience that the user encounters. And what does such inefficiency indicate? In a dark corner of the mind, the user begins to ask: Are you inefficient or disinterested in other factors as well, maybe even in the real-world customer experience? A customer may very well decide against using your poorly performing and “disinterested” service, shop or product if they believe they will be treated as negligently in the real world too. Both the virtual and physical dimensions tend to get conflated into one overall impression. Remember: Trust is very easy to lose, and very hard to earn. Same goes for brand equity, goodwill, brand preference and all of that marketing lingo. Failing here could mean a user’s interest in your site/business starts evaporating. Soon that person just won’t return any longer.
Lesson to be learned: Poor performance is akin to a salesman with poor people skills. As noted in point #1, certainly do not take your customer’s money just for visiting your site — which is exactly what you are doing when you have a poorly performing site. It’s basically robbery. Cater to the user experience in religious detail—just don’t lose sight of core values, such as being to the point, being helpful, being clear in communication and interactions, offering something of concrete value, and so on. Make sure there is alignment between your digital and physical attitude and that youare able to concretely deliver a responsive experience.
3. Technical Hygiene
Offering high-grade (performant) experiences are going to be a whole lot easier if technical infrastructure is seen as a key partner together with design, thus partnering the realms of technical design and visual design. Just like visual style guides and front-end component libraries need to be in ship-shape, expect every surface that affects performance to require being top-of-mind when working on visual design, new features and functionality, etc. The user’s experience of your background technology will never be as evident as in their experience of its performance. Upgrade the survival chances of the design by setting and delivering a high technical performance level early.
One step in getting there is to disallow technical debt or single functionalities to eat away at the performance budget. Just say no! For example: Standards like analytics and tracking would need to be very well integrated to not affect performance too much. The implication, just to be clear, is that even their usage could therefore be stopped because they might negatively affect a higher business goal, which we might call user experience in this context (by way of unacceptably decreased performance). This third point might not be quite as easy to swallow as one might initally think, at least for some parties.
Lesson to be learned: Make it clear to the team and stakeholders that performance—just like SEO has become—is a key factor when deciding on new designs and development. Performance is not a singular feature or an on/off switch you just flick. Its presence is always there, but hopefully not in a bad way. The goal is to keep it out of sight, which we do by remaining vigilant about how performance can be impacted by certain changes.
Some core tenets of web performance
There are a few tenets I believe are especially important when working with performance. Everyone who is invested in this area will have some, but I think these catalyze the fundamental strategies and reasoning behind this kind of work.
- The best code is no code. Same story for downloads, requests, and everything else. From the broad to the miniscule: How much can you shave off? Premature optimization is obviously not preferable, though! But begin to think of this as a timeline. Technical debt will increase over time if an initial solution is poor and bulky. Post-fixing stuff is almost always harder than setting up good, managable criteria early-on. By commiting to a discipline of “less code, better code” we avoid to build a jungle where we want a well-ordered garden. Less code will mean less assets, which means less requests, and so on. This mentality needs to be adopted and worked-on as a team. It’s easier when starting fresh, but it is never to late to start living clean, so to speak.
- If a computer can do it, let the computer do it. Most of the obvious technical performance gains will come from letting automation do the tedious optimization work for you. While the specifics of the tooling will likely change over time, knowing how to automate is already a very valuable skill. Learning and using automation is not a waste of time.
- There is no one-size solution. There are many best practices you can use which will deliver better results than old legacy solutions any time of the week, such as using responsive images and minifying code. However, some things—if you want maximum leverage—will be dependent on your larger ecosystem and project, such as preloading fonts (which can be super good, or pretty slow, even unnecessary) or doing HTTP2 server pushing. Also consider how your choices will affect bandwidth/network or parsing. A super-fast site built in React can be fast on a phone as well, but it may take a long time to run that first paint and put some life in it. Server-rendering may give bigger payloads but require less parsing. There’s also the dimension of CPU and GPU processing, both being slower on mobile devices. Weigh what part you want to prioritize.
- Make sure to always aim high and use optimizations that are already provided through browsers. With the high degree of users on evergreen browsers and the constant work being put into standardizing the web, the web is (or at least could be) a very different place. What Airbnb does for its performance is not magic—much of it is stuff you can do too. Even if support for a certain performance-increasing feature may be relatively low today, it is very likely that it will be common-place before long. Many of these improvements, such as using defer/async attributes for script loading (supported since way back) and Service Workers (few browsers currently support them), are essentially harmless to introduce in a project. They will progressively enhance the site, falling back to other means (or silently dying) if they can’t work in the browser. Performance must never be seen as a thing to be balanced based on the lowest common denominator—it’s an assumption that makes no real sense, only damaging the user experience and potentially even worsening the development potential of the project.
- Aim for no lower than IE11 support. You are going to make huge winnings in development time (= money saved), library support, interoperability, and the sheer fact than IE11, though a crap browser, is at least somewhat standardized. Usage statistics at Statcounter show total IE usage to be 3.35% in December 2017. For the entirety of 2017 the number hovered around the same value, indicating the very real possibility that these are just legacy machines trying to stay in the game. We must allow to say no to legacy, especially as no one is realistically going to think browsers like IE9 are up to snuff with a recent browser anyway.
Practical performance work
The user wants to see something—fast! In our terms, they want a fast First Meaningful/Contentful Paint. While that is not the entirety of the issue, that’s a good target to shoot for. How do we get there? Well, we will need to set some goals:
- We want to unblock rendering so content can be seen faster (the so-called Critical Rendering Path).
- We want to request the least number of assets possible.
- We want the assets to be as small as possible.
- We want to receive multiple assets at the same time (if possible).
- We want to only request what we need right now.
- We want to prioritize resources according to what is most important for the user.
For a more in-depth guide to a like-minded strategy, you could always look at Google’s PRPL (Push-Render-Pre-cache-Lazy-load) pattern. This article and Hiperf are highly influenced by it, but I’m not sure Addy Osmani would say these were 100% on track ;)
How to use the Chrome Developer Tools to do your own performance testing
All of the below images are based on inspecting Google (the search site, duh) using Chrome’s Network panel to look at the metrics and data.
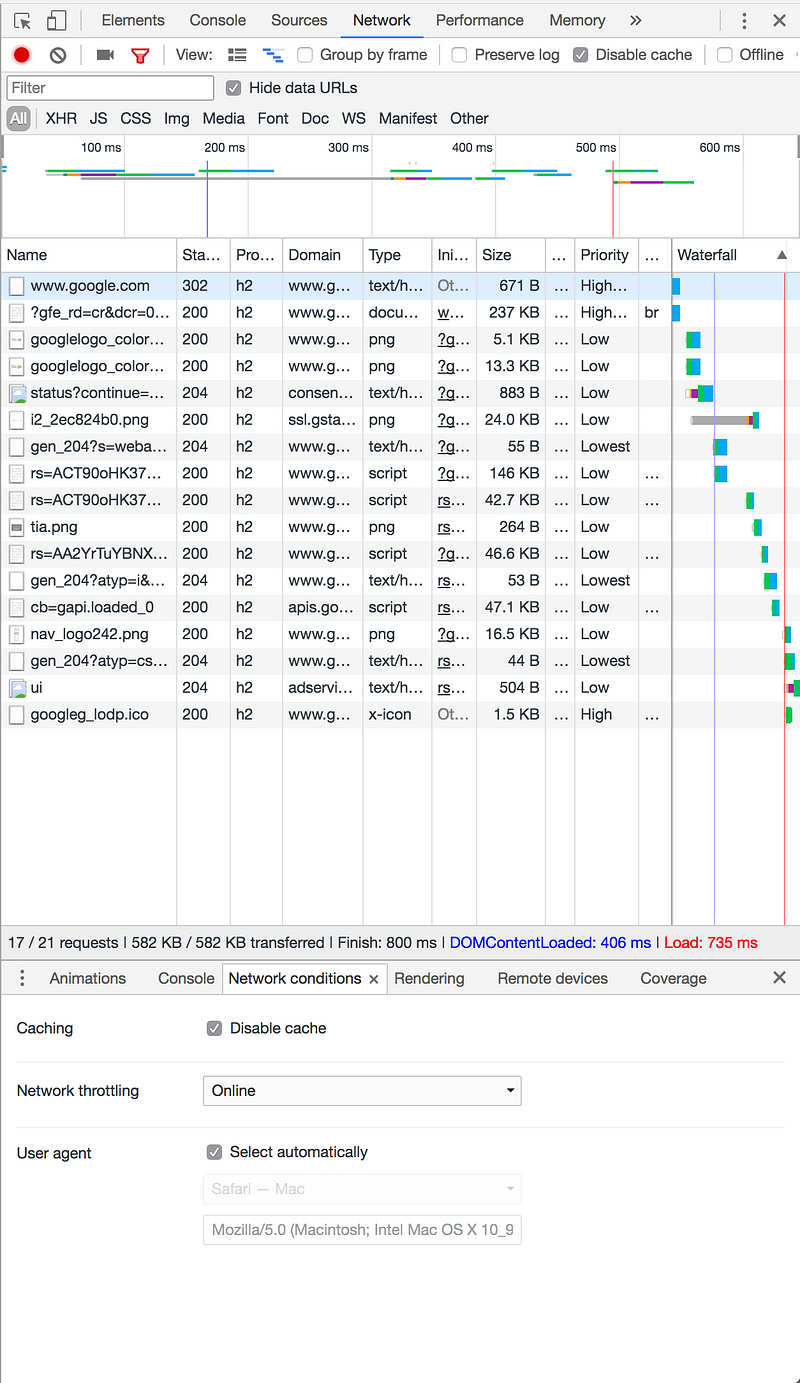
In the Network conditions sub-panel we can easily enable/disable caching, set a browser (user agent) and throttle the connection. Expect to use these settings a lot! This is the panel where we view response codes, protocols used, domains serving the assets, type, asset sizes and resource priority among other things. The panel is customizable, so set it up to show what you want to know. Waterfall to the right is probably the key item, together with the stats in the lower bar of the main area. That’s where you get request count, KBs transferred and the times to finish, until fully loading the Document Object Model’s content, and the time it took until the Load event was fired.
Note: When you test your site, you normally want caching to be disabled. Turn it on when testing cache features and/or service worker functionality.
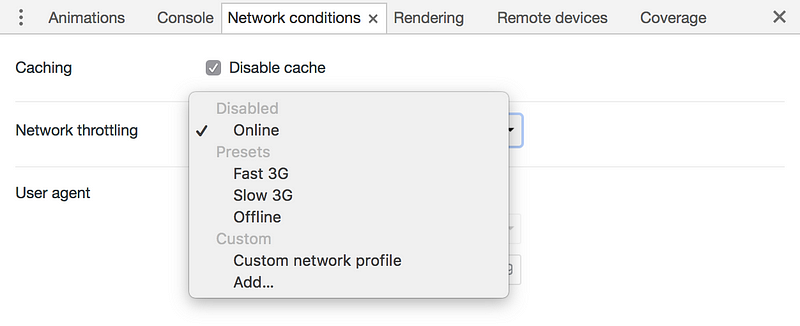
Online refers to whatever your connection is, so never use that as a relative measurement when doing tests on your own machine and computer. A more reliable choice is Fast 3G which I believe that Google Lighthouse uses as well. Setting these to something other than Online will cap the connection and therefore become more valid as a testing tool.
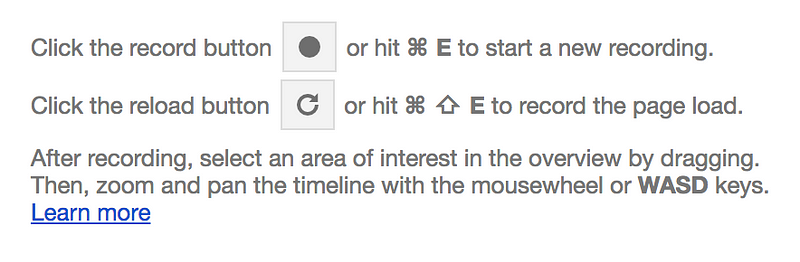
It’s possible to record the page load. This is the single most frequent command you’ll run when doing performance testing. Pro tip: The reload button is the one you probably want to use, unless you want to record and measure some other sequence of events/loading.
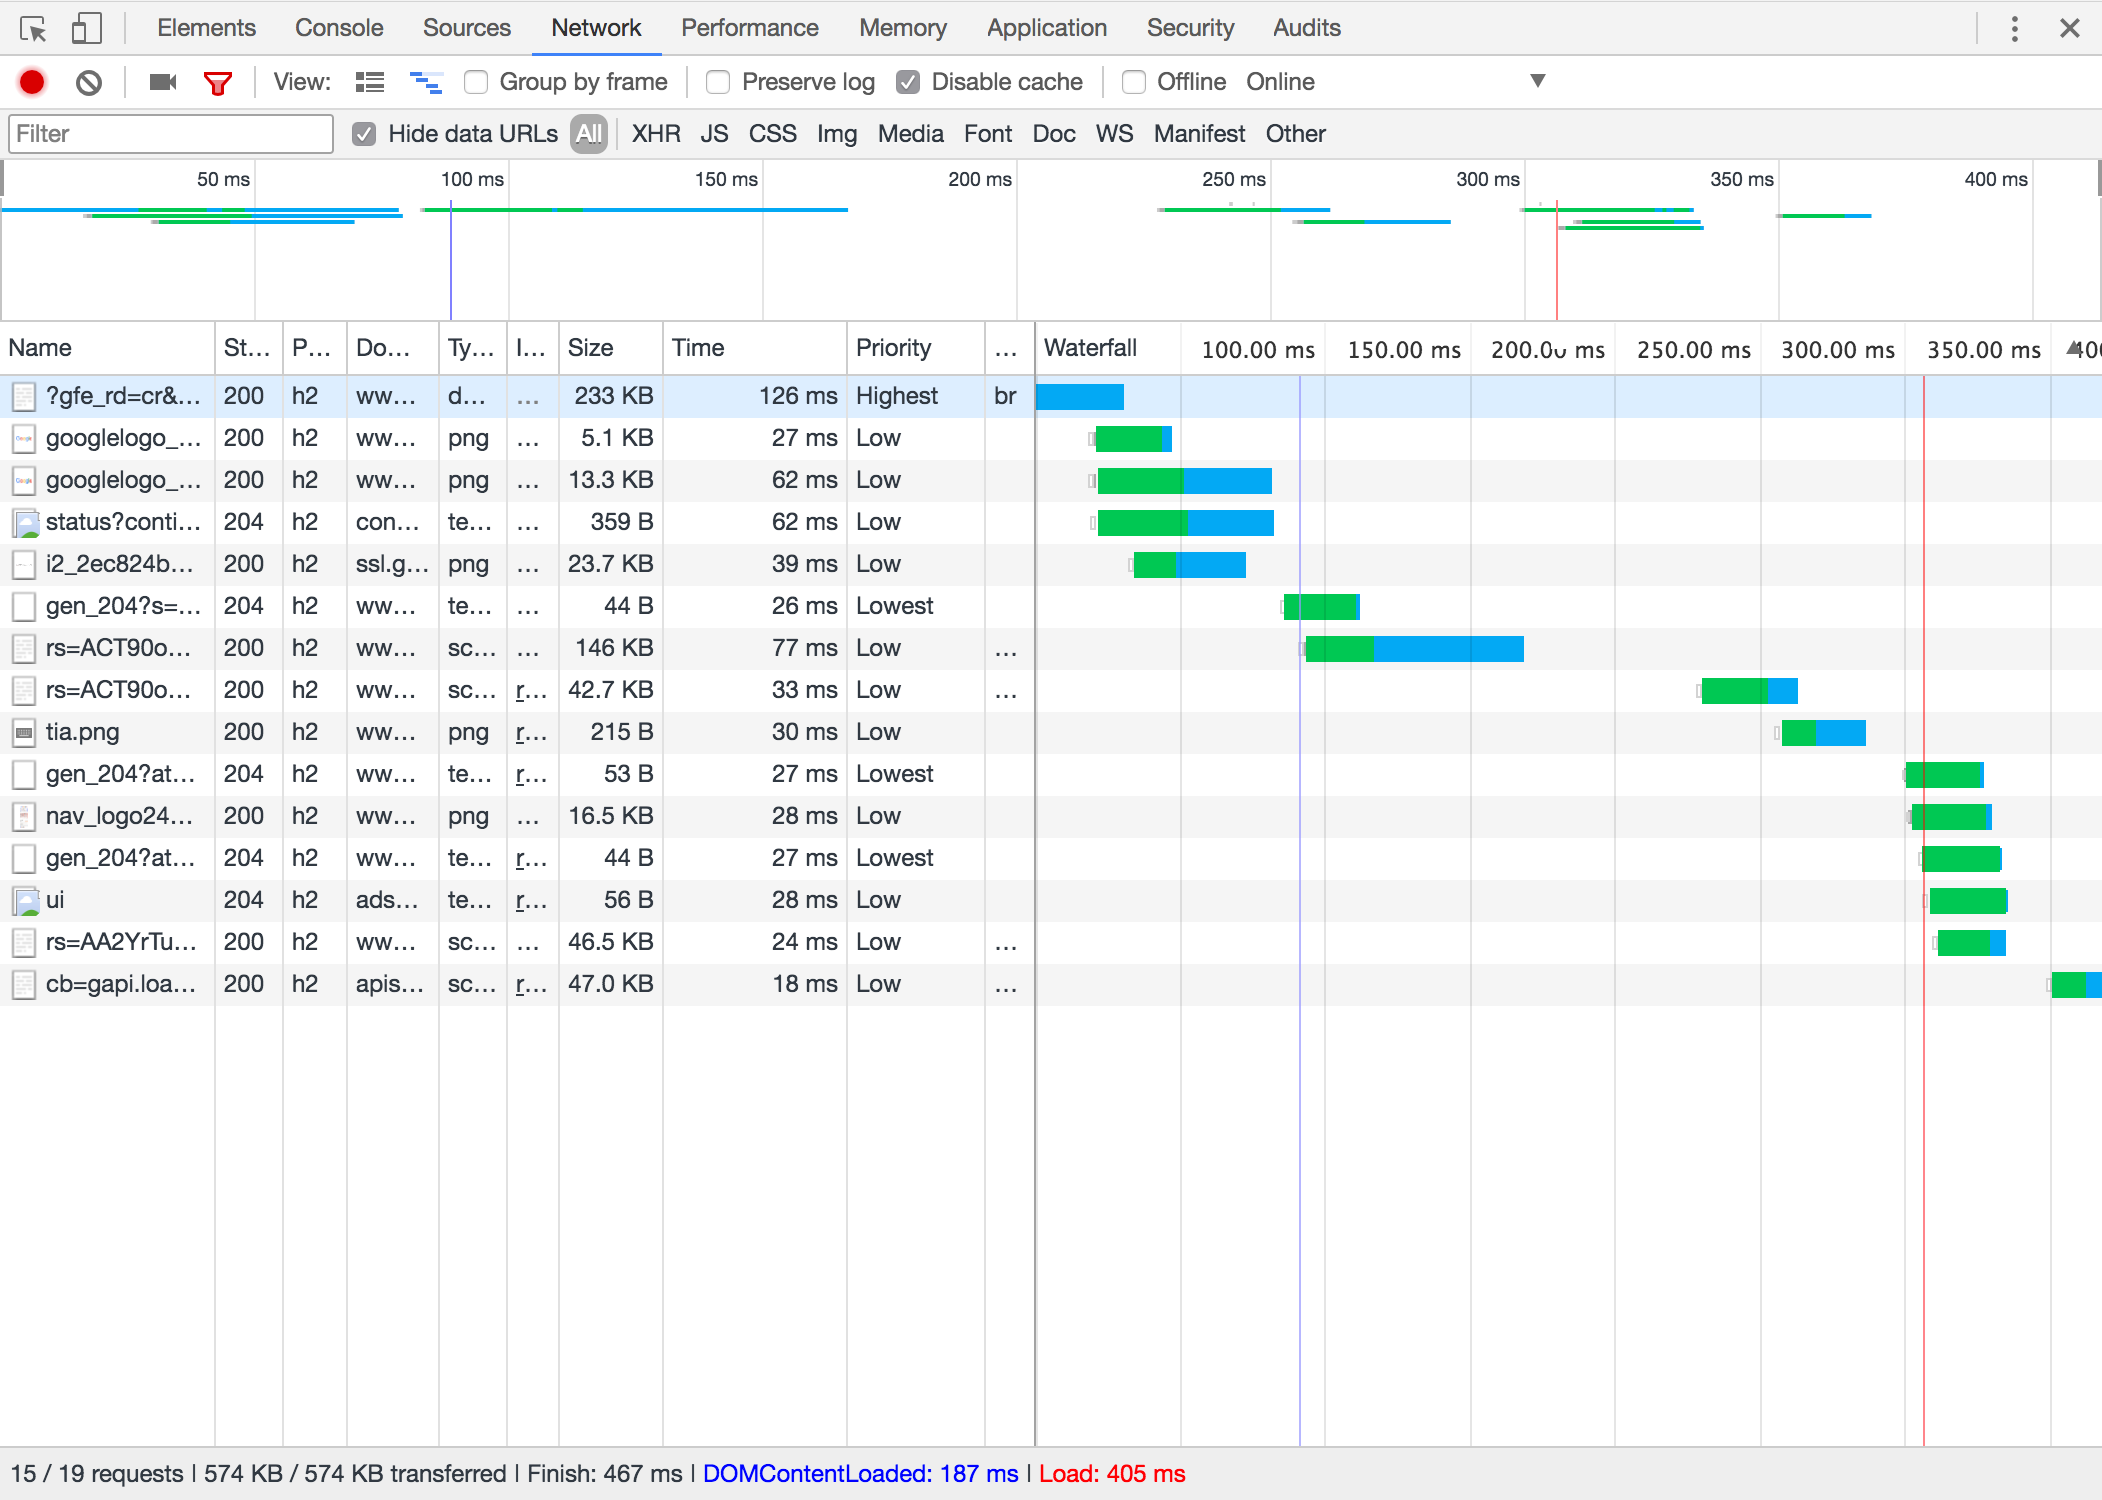
Above we’ve done a recording of the page load. From this view we can see that things like: Google only serves their main JS with Brotli compression, that every single resource except the JS has the low/lowest priority, and that they have a very speedy site based on the low values on finish, load, low request count etc.
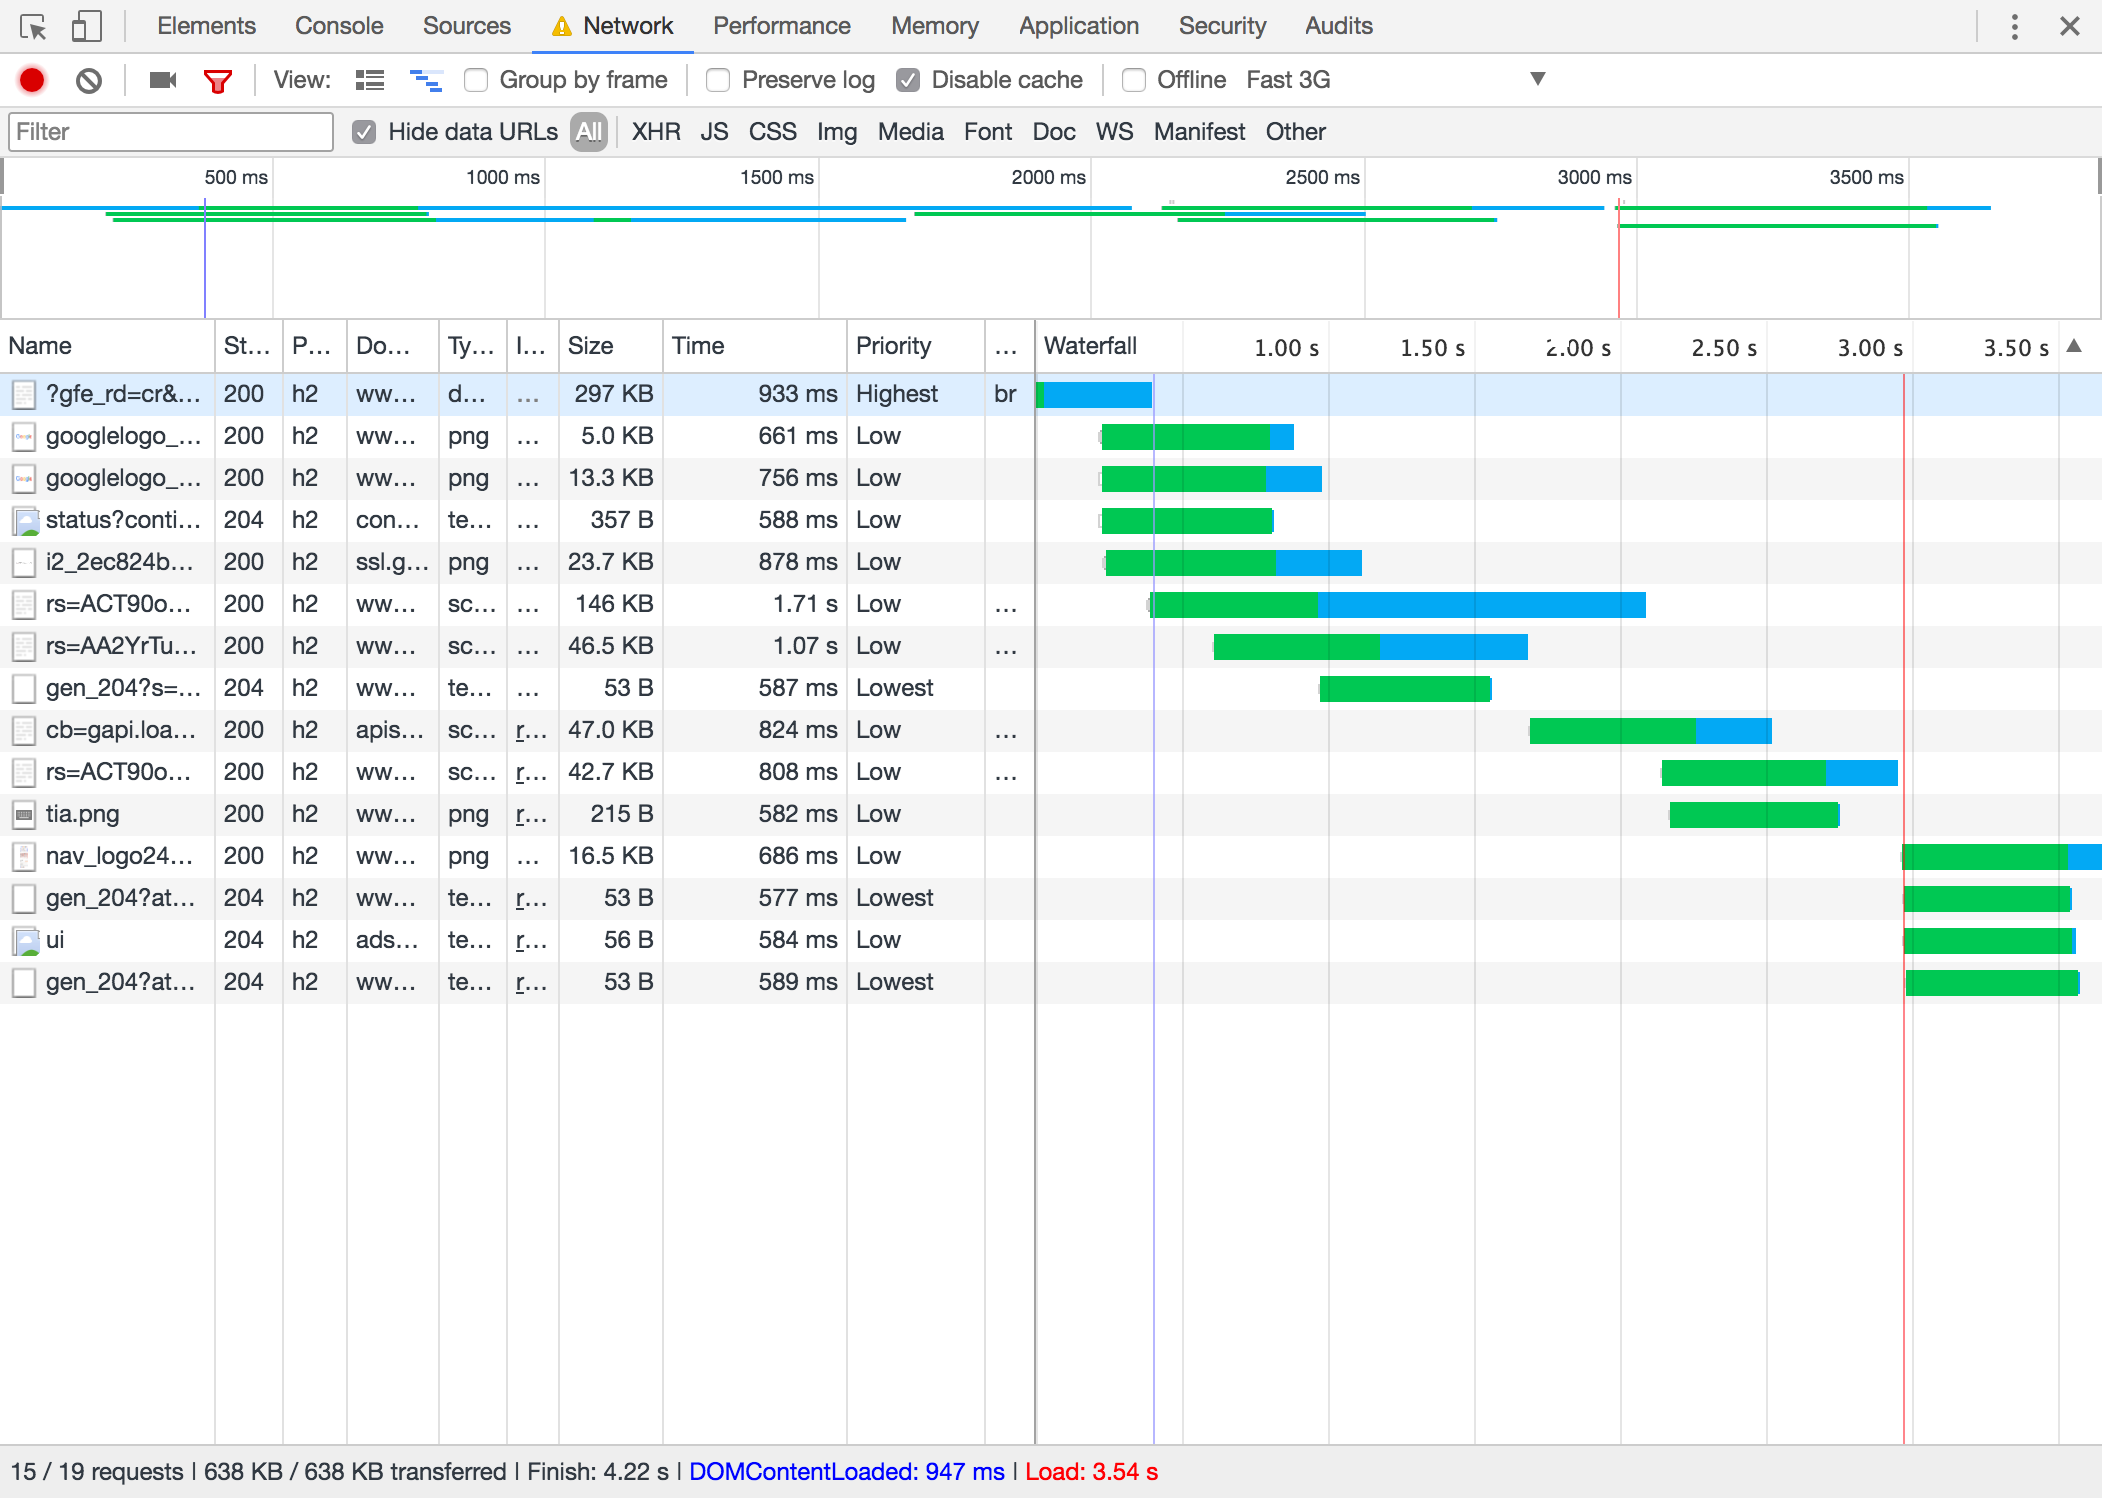
Setting the network to emulate Fast 3G and recording the page load will give us a somewhat different set of numbers. We can now see that the load time is higher and that the waterfall display longer blue lines to indicate the longer download time. Note: For more detail you can hover over the waterfall bars to get more information, beyond just the status of Waiting/Downloading.
Moral of the story is that not even Google is instantaneous on an old phone with a bad connection.
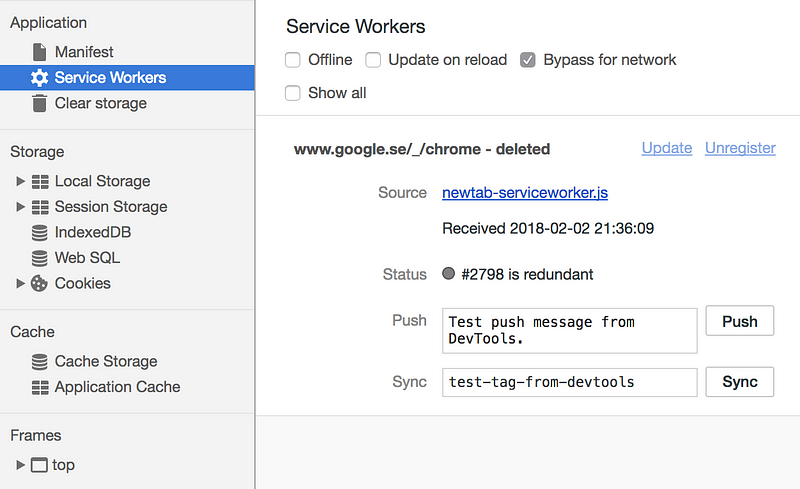
If you use Service Workers, you can also see them in the Application panel. Make sure you’ve disabled Bypass for network and enabled Offline when you want to test that the worker is functioning.
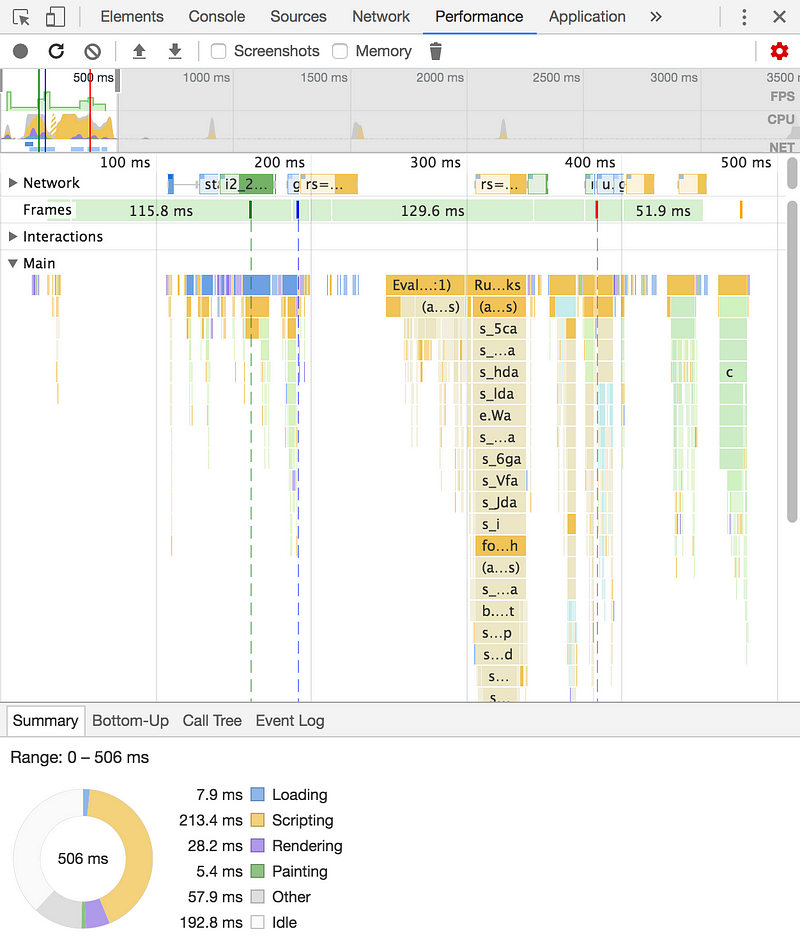
Performance is a panel where a whole lot of intricate data gets reported. This is where you want to go when the time has come for runtime performance analysis. It’s possible to see what script functions run, what they do, if they require sections of the page to be repainted and so on. One could also use this panel to identify unusally slow Javascript. I can’t say I use this panel too much.
This mini-guide has given you a brief look at how to start performance testing with Chrome. Testing 101 should be about you having the skills to collect the lower bar values (Finish, Load time…) and seeing how they update when changes have been made. For a more detailed guide to Chrome’s Network panel, please check out Google’s documentation.
Before moving ahead, it’s probably good to have jotted down your numbers for your site or app.
Set up a performance budget
Go ahead, do it. It’ll take you less than a minute to have an idea of the numbers. While the Performance Budget Calculator is somewhat simplifying matters, it does give a good idea of exactly just how small the margins are in getting something to the user in the space of an instant.
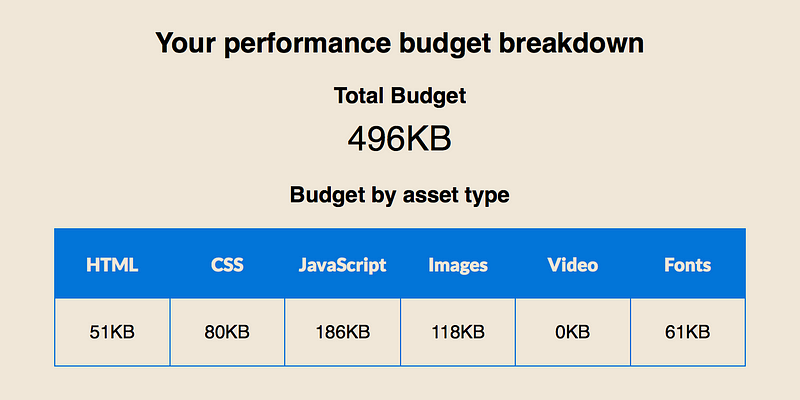
Your immediate reaction is probably “hell no!” when you see the tiny numbers, thinking your bloated project will never witness another day if going head-to-head in a comparison/battle with whatever lean, Bruce Lee numbers are being presented here. For that reason alone, you’d want to keep the stats as a crystal-clear yardstick in the back of your head for the work you are about to undertake.
Basic methods
In this section I’ve listed a number of items that should be easy enough to implement in almost any project without introducing risky or time-consuming changes.
- Optimize the script loading order to avoid render blocking and getting maximum throughput.
- In the HTTP era, inlining of scripts and styles was a good thing. Now however it’s not quite that simple. Inlining code will make the HTML payload heavier and is not likely to get cached. Do use inline code where cutting an external request is a better deal than having a bit heavier download. With HTTP2, consider using server push (which has caching) or just rethinking bundling and splitting strategies.
- Use Resource Hints such as Preconnect or DNS Prefetch to quickly set up connections with any external domains.

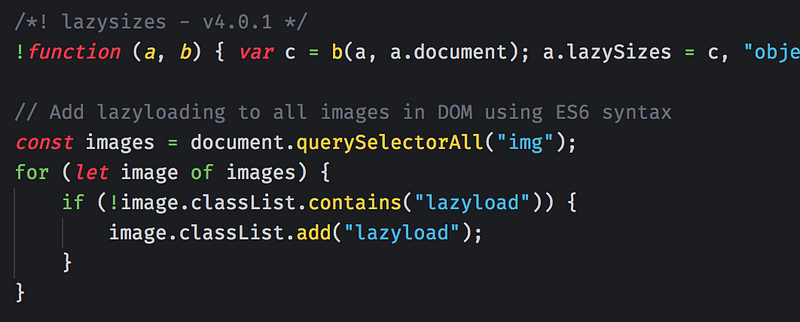
- Lazyload images. Use a library like lazysizes or do all kinds of lazyloading with the native IntersectionObserver.
- Add defer (to your own files) and async (to external files) attributes to all Javascript files that get loaded on your site.
- Also, asynchronously load your CSS file(s). Make sure this happens in the <head> section to give the browser immediate knowledge about the CSS resource it should expect. Loading CSS in other places of the document is an anti-pattern but may in certain cases seem to make sense. Be wary about that notion, though!
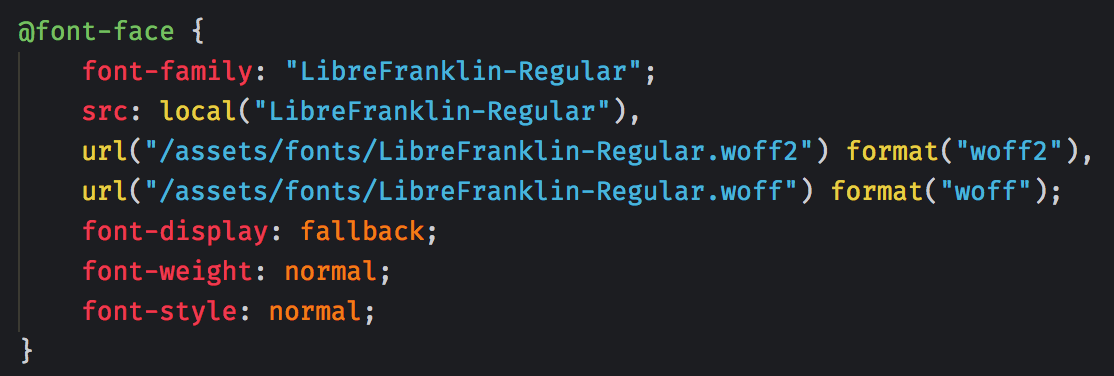
- For webfonts, use only WOFF2 and WOFF formats if you do not know with absolutely certainty that your site needs to cater to legacy font users (TTF/OTF/EOT formats). For those users, instead consider letting them use a fallback system font stack which makes sense so you can get rid of the heavy old files. WOFF2 and WOFF are comparably super-lightweight—expect WOFF2 to be 3–5 times smaller than TTF. Additionally, prefer locally installed versions and offer an explicit display (font switching) mechanism with font-display.
- You can preload fonts as well, but be wary about potentially increased load time as a result of this.
- Always serve minified code. Preferentially also concatenate files that should be served together, i.e. bundle them. If build tools (which I’ve placed in the “Advanced methods” section) sound scary then at the very least use a good GUI tool, web service or command-line utility to do this part for you.
- Don’t build and serve monolithic (big, bulky, “complete”) bundles. Split them into reasonable chunks—aim for a good standard such as: manifest, vendor and/or common libraries, and then whatever number of route/page-specific code you need. This easier with Webpack (in the Advanced methods section), but the gist is to serve “just-right” sized assets, so no 500kb JS bundles which browsers may choke on.
- Use responsive image syntax. Come on! It’s 2018 already. Also, consider using a component to handle the rendering of markup as it’s usually so long that you’re already reaching for the coffee machine halfway through writing that markup.
- Use SVGs instead of PNGs or icon fonts. Absolutely do optimize them, since they include lots of junk such as metadata which is entirely irrelevant for an online image asset. In regards to file size, SVGs are extremely small in almost every case, and also have the nice ability to scale infinitely since they are vector-based, rather than raster-based.
- Optimize your images. Depending on your setup you will want to investigate what makes sense. Consider compressing all static assets right in the build tool, with a GUI tool like Imageoptim, through the CLI, and/or use a service such as Cloudinary to serve optimized images from the cloud.
A free book on modern image optimization techniques. Formats, decoders, techniques for efficient compression and more…images.guide
Manage web and mobile media assets with the leading cloud service: image and video upload, storage, manipulation…cloudinary.com
Advanced methods
The following methods are called “advanced” because they will require more of the developer and/or rest of the team. Some may require more time, some more knowledge, and some may demand that you restructure your entire project. Note that some of these methods are actually very fast to implement, but will assume a fairly competent developer.
- Use modern vanilla ES6+ or TypeScript. Drop jQuery. Like most bad habits, you’ll never pick jQuery up again after the initial withdrawal period. You can easily transpile ES6+ code into ES5 with tools like Babel which pretty much every browser understands if you think you may lose users.
Let function fn () { let x = 0 if (true) { let x = 1 // only inside this `if` } } Const let is the new var. Constants…devhints.io
- Consider skipping transpilation and output all Javascript as ES6(+) code. All evergreen browsers support a great deal (or all) of the ES2015/ES6 syntax. You can save a boatload of KBs by not transpiling. Either use a smart, dynamic polyfill like polyfill.io to get semi-magic automatic for ES6 in browsers that don’t natively support it, or compile separate ES5 and ES6 bundles and serve the right one to the client.
- Don’t program the front-end through the back-end. Using MVC stuff like Episerver, SDL Tridion or other systems that base themselves on C# or other non-front-end languages are just going to make things harder to develop, keep concise, as well as likely introduce .aspx files and other things that will probably be hard to performance-optimize. I’d hope to find links here, but rest assured that I am speaking from personal experience. Few things have ever been as painful as this.
- Consider using a framework like React (16+), Angular (4+) or Vue, all of which are lightweight and super-fast. Don’t succumb to Javascript fatigue and burn out trying to learn everything—make a choice based on what suits your work and prior knowledge. Choose something that people actually use today, so no Ember, Dojo, Knockout or somesuch. A framework also has performance benefits that come by setting limits on how the framework expects to be used. This keeps code bloat and weirdo solutions away to at least some degree.
- Avoid third-party scripts, which can be easier said than done depending on your organization/client. Investigate ways in eliminating, lazyloading, deferring or otherwise handling the performance-related parts of this issue. Further, in order to make a solid case for avoiding the scripts in the first place, notify the right people about the implicit security vulnerabilities when using third-party code.
- On the same note, be very careful and selective about how you use analytics and tracking tools. Besides the security and privacy implications—which will only become stricter with the EU’s General Data Protection Regulation come May of this year—the team should be well aware of the performance impact of such tools. Example: Hotjar (with basic settings) takes roughly 70KB just to have on the site at all. Google Tag Manager and similar systems can unfortunately easily be drowned with data that gets loaded client-side first. Without being an expert, make sure that any processing or setting/sending of information is done in GTM (or similar) and not via heavy client payloads. I have personal experience of a site that has a GTM config downloaded and parsed client-side, weighing in at 80KB uncompressed.
- Set up build tooling. If you haven’t, move to Webpack. Webpack can be a bit intimidating when it comes to configuration so if you really, REALLY hate config-doodling, use Poi or Parcel which spares you a visit to configuration hell.
- Use route splitting and/or component splitting. Both of these have been a pain in the a$$ to implement previously, but thanks to packages like react-loadable this has become much easier.
- Use bundle analysis tools to optimize what gets built and into which files their content goes.
- Set up gates that error your build (or just give you a stiff warning) in case you exceed the performance budget. Add size-limit on top for good measure.
- Don’t use huge libraries. Examples include jQuery (especially old versions, jeez), Foundation, Moment, and Lodash. You can usually load parts of these, if really necessary, but then you also do need some kind of modern JS handling to support imports and make sure you take only what you need. A better solution is simply to switch to lighter-weight alternatives or use built-in standards.
- Write good, clean code. Clean code is legible, effective and functional. It is not terse—let uglification solve short variable names and all of that. Also look at styleguides, like those used at Airbnb or Google to be inspired how to adopt or adapt your way of writing code to high standards.
- Inline or server push critical CSS which is the parts of CSS you need to serve for the user to have a complete visual experience of the first view. Essentially, you want to provide only those bits that constitute the first screen and get the rest later, asynchronously. This technique may be rather tricky to get right, and can also impact the cascade of your complete CSS. Anyway, you certainly don’t want to attempt this technique by hand! Use something like a Gulp plugin or at least a web tool.
clean-code-javascript — :bathtub: Clean Code concepts adapted for JavaScriptgithub.com
- Don’t use JS to do CSS work. If you have a site running lots of that stuff, refactor it to use modern, responsive CSS. Much faster, much easier to build, much easier to maintain, much less hacky.
- Rearchitect your CSS to be ultra-flat and small in size. CSS libraries like Tailwind make this easier. Don’t use Bootstrap unless you want a full, template-ready UI kit—my personal opinion on this is that a UI designer should have the chops to take control of their own product, otherwise they are just trying to do some kind of alchemy. OK, so how small is small then? There’s no true, objective number, but please God please don’t let it be 1.1MB as it was in a project I worked on. I’m sure even a bigger project could fit well under 250kb uncompressed in total, which beings me to…
A utility-first CSS framework for rapidly building custom user interfaces.tailwindcss.com
- Consider using CSS modules or other partial loading to only load CSS that you need on a specific route/page. PostCSS may be of help.
- For animations, use CSS (here’s also Google’s writing on the issue). There’s tons of libraries and helpers, and unless you’re doing highly complex animations or know JS performance optimization like the inside of your pocket, there’s no need for JS here.
- To get optimum CSS animation performance, try to only use CSS properties that are GPU-accelerated such as transform3d().
Most people now know that modern web browsers use the GPU to render parts of web pages, especially ones with animation…www.smashingmagazine.com
- Serve exclusively from HTTPS/HTTP2. Build and serve assets accordingly. If you haven’t already made the move, your site is soon going to have major Google trouble if you’re not on HTTPS.
- Host your site/app on a CDN. CDNs used to be ultra-expensive, but these are now commonplace and cheap. So common, in fact, that some services offer CDN for free. I’m totally in love with Netlify which offers a comprehensive free tier, works extremely well, offers CDN+HTTP2+SSL, is super fast, and doesn’t care one bit if the hosted site is commercial or not.
- Use at least Gzip server compression, but aim straight for Brotli or Zopfli if you can. Consider using Cloudflare as your DNS: you can get it for free, it’s easy to configure and offers Brotli straight out of the box. Brotli compresses very, very well—expect around 10–20% smaller sizes than Gzip.
- Precompress assets for the server already in your build tool. Strive for at least Gzip and Brotli compressed versions, as well as your regular distribution assets. The compressed versions get automatically picked upon the server when they are available. This technique is called static compression, which effectively removes the need for dynamic compression (server-side) while serving assets, since this work is already done by you.
- Set up a Service Worker. You will also need a manifest file, which you can easily generate. PWA: Service worker för offline och lokal precaching. Let Mariko Kosaka give you the soothing ice tea version if this all sounds a bit scary.
- Consider font subsetting (also read Bram Stein’s notes on doing too much of this + check his links for good tools/resources) and do overall font optimization.
- Consider implementing a native browser check for getting the user’s connection type. It’s not yet super-supported but can add some network-responsivity with small means, especially if you serve really big assets such as video.
Conducting performance testing
When you test your site you should have some metrics to go by. During the first few tests the numbers will be new and it’s still going to be somewhat opaque why exactly you are measured to a certain score. Begin testing almost as soon as there is something to look at. Stop testing when doing bulk work, and resume when there are bigger changes happening, like a new big component is introduced.
Don’t make testing a thing that only happens once or twice a year to be part of a report. Use it every time you’ve made changes that need validating. Just like with agile development, you shouldn’t get caught in a waiting game. Test it!
Please note that all of the below tools are primarily (or only) focused on client-side load performance and all which that entails. For ongoing, run-time performance testing you’d want to look at other tools. The areas do overlap a bit, however, especially in regards to some of the advanced methods listed above.
Testing requires a deployed site
All of the following tools will require that the tested site is online. Your testing can therefore never be faster than your deployment is.
My highest recommendations go to Netlify for overall hosting and deployment, but you might also want to look at the extremely nice, super-lean Surge or Now for almost-immediate deployments via the command line. They work especially well for doing quick and dirty real-world testing, and you get a randomized domain name. See it as a short-term deployment—though they can do much more than so! Those two services have saved me tons of headache when doing demos and testing. Every one of these services offer superb free tiers so don’t hesitate to at least try them.
Netlify CDN Make your site or web-app many times faster by bringing it closer to your users. Instead of a single…www.netlify.com
Shipping web projects should be fast, easy, and low risk. Surge is static web publishing for Front-End Developers…surge.sh
Recommended tools
The new king of performance testing is arguably Google Lighthouse. It has a pretty explicit bent towards Progressive Web Apps, which may or may not be a kind of site/app that you’re building. Just ignore the scoring in that department if you don’t care. Runs as a Chrome extension or a NodeJS package. Testing in Lighthouse is integrated in Hiperf.
Learn how to set up Lighthouse to audit your web apps.developers.google.com
GTmetrix has also been around and is a very common, widely used choice. Very detailed data, lots of metrics, clear user interface (in terms of performance tools at least) and actionable suggestions make for an absolute must. Use this as your primary non-toolchain testing tool/site.
GTmetrix is a free tool that analyzes your page’s speed performance. Using PageSpeed and YSlow, GTmetrix generates…gtmetrix.com
The grand old man of testing sites, Webpagetest. Lots of browsers and locations to test from. Not very pretty, and can be a bit slow to queue within but gives a whole lot of data.
Run a free website speed test from around the globe using real browsers at consumer connection speeds with detailed…www.webpagetest.orgSitespeed.io — Welcome to the wonderful world of Web Performance
Sitespeed.io is an open source tool that helps you analyse and optimise your website speed and performance, based on…www.sitespeed.io
For a broader scan of your site, Sonarwhal aims to deliver results in things like accessibility, performance, security as well as interoperability. This should be a standard in your toolkit as it reminds you not be totally myopic but see the the whole picture. Sonarwhal is the third part of Hiperf’s test tooling.
sonarwhal, a linting tool for the web focused on best practices and flexibility for the end usersonarwhal.com
A staple to run for quick-and-dirty testing, Pingdom’s Website Speed Test is a classic. It’s like a leaner, even fresher-looking GTmetrix, but with less detail. Choose either one, or do both.
Use this free Website Speed Test to analyze the load speed of your websites, and learn how to make them faster.tools.pingdom.com
You thought I’d leave out PageSpeed Insights? Ha! Never. If there is one tool which even the BA people know about, it would be Pagespeed Insights. However, a word of advice: Lighthouse is beginning to eat away at PSI (as it’s abbreviated) in terms of detail level and actionable advice. PSI nowadays does come with a couple of features that are very neat though, and that is its data from Chrome User Experience Report and the new diagram which shows values based on a number of visits rather than one individual test case. Keep using it, but not only this.
PageSpeed Insights analyzes the content of a web page, then generates suggestions to make that page faster. Learn more.developers.google.comByte Check - Check Your Time To First Byte
Check the load speeds of and information of a given websitewww.bytecheck.comTestmysite.io | Netlify Speedtest
descriptiontestmysite.io
Changes were made mainly by adding route-splitting, removing an expensive NPM package, optimizing Webpack’s bundle distribution, as well as doing changes to the base HTML index file to further enhance file requests. Images were also somewhat oversize on mobile so the image component was rewritten to request more suitable image sizes.

Webpack makes it fairly easy to fix performance issues related to Javascript. While the optimizations themselves were not quite trivial, in raw numbers we received one hell of a boost with only a few new strategies implemented. Lesson learned is that it takes much more from a developer to make big, easy gains when the stack is leaning more toward a framework-based one. It would be interesting to see what component-splitting and server side rendering could add, if anything, to this.
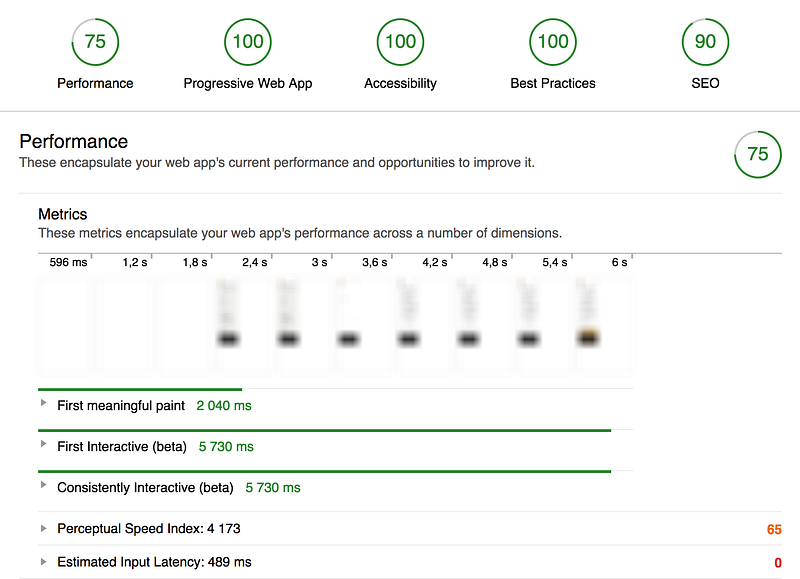
Results: Case #1
Request count: –31 requests or –53% (58 — 27)
Transferred: –71% (2.0MB — 583KB)
Finish: –84%/–49% (6.46s/2.0s — 1.02s)
DOMContentLoaded: –61% (631ms — 243ms)
Load: –34% (1.10s — 730ms)
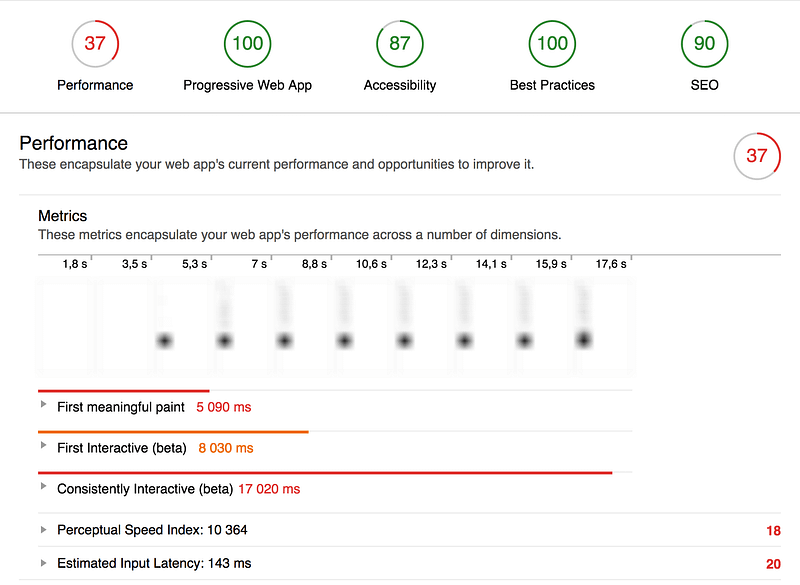
Performance score: +32 (37–69)
First meaningful paint: –49% (5090 ms — 2580ms)
First Interactive: –19% (8030ms — 6540ms)
Case #2: MVC/HTML+CSS+jQuery-based brand site for major company — Laravel/Gulp toolchain
This is a fairly classical site with a backend in MVC (C#) and based on templates made with Razor syntax. A few years back an ad agency created the visual design and a big-name consultancy did the technical implementation and front-end. Primary of the deficiencies would be that first-party assets are not compressed and optimized. Further, the back-end does the bundling–not poor in intention but troublesome to optimize for a front-end person and asset bundling gets placed outside of the front-end context.

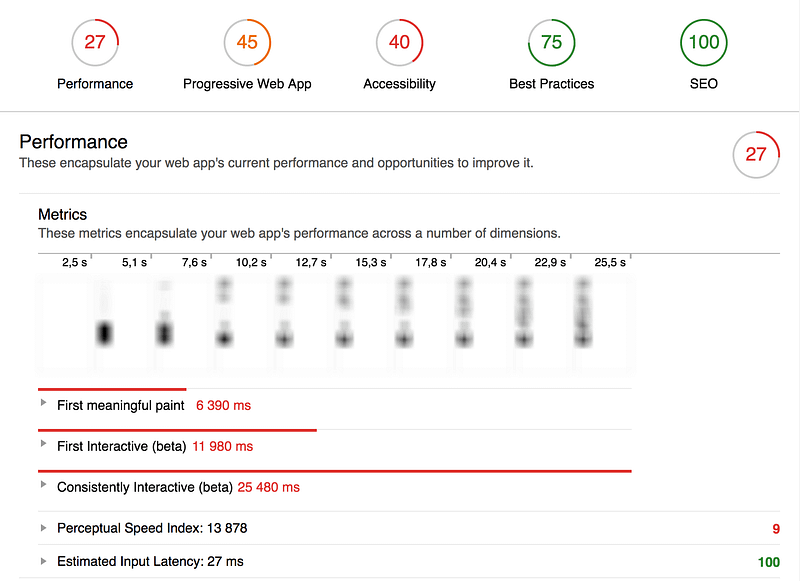
The changes involved here are numerous. From the current build pipeline I output an optimized, smaller CSS bundle as the original one was frankly huge and unusable in its current state. A few changes were also made to increase accessibility, as well as adding a basic manifest file. The service worker itself was not created here, because that could well be out of scope in this specific client context. This project has a LOT of holes to plug and there is no short-term possibility to do meaningful optimizations on the Javascript parts, nor add all of Webpack’s bells and whistles. Thankfully most of what’s going on has to do with the “basics”, such as images being improperly compressed and sized, hosting being poor, too sharded and splintered file serving, etc.
The results are not strictly scientifically comparable as differences in hosting and CDN will affect scoring, and that some of the CSS on the POC site is not quite 100% functional because of the leaner CSS bundle that I created. In regards to request count and load time it should be about right, though. While the POC is not completed nor 100% feature complete, it does highlight a number of rather extreme performance gains to be had.

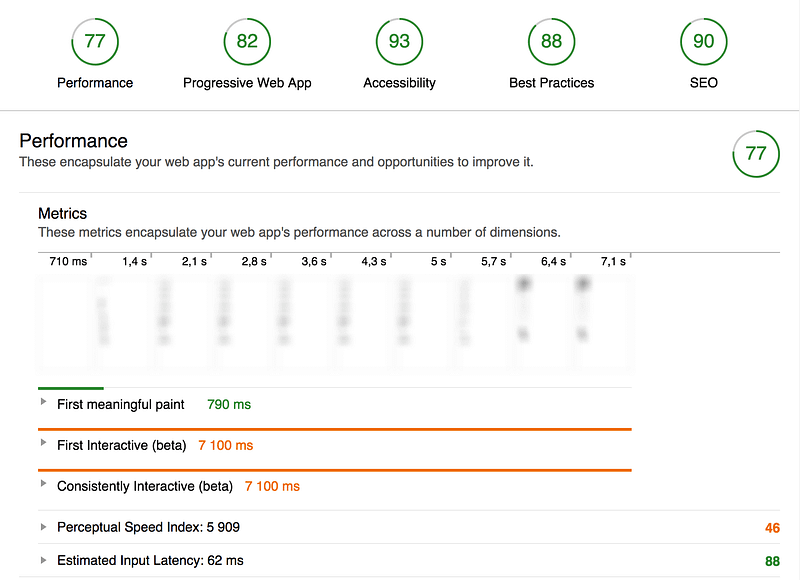
Going from the current performance profile to the POC has not involved many challenges as such, but quite a few hoops. Offering a “classic” site like this in a performant manner is, as illustrated here, not all too hard. The most obvious remaining critical steps would be to move to Webpack and potentially rewrite JS and CSS to more modern specs and squeeze out some optimizations that way. There are also a number of bloated legacy libraries that should be replaced or their use rethought. I am sure it’s possible to take the score to 90+ if doing those changes.
Results: Case #2
Request count: –47 requests or –49% (96–49)
Transferred: –84% (4.4MB — 723KB)
Finish: –23% (2.86s — 2.25s)
DOMContentLoaded: –43% (855ms — 491ms)
Load: –59% (1.47s — 606ms)
Performance score: +50 (27–77)
First meaningful paint: –88% (6390 ms — 790ms)
First Interactive: –41% (11980ms — 7100ms)
Consistently Interactive: –72% (25480ms —7100ms)
The top 5 things you should do right now
OK, so you came this far – now for the actual work! Below I’ve listed recommendations that should be possible to implement—or at least test in a decent manner—within a few hours, with the build tool part taking most of the “heavy” work.
- Do a round of thorough testing with at least 3 different tools before doing anything from this list. Do multiple tests with each tool to avoid any weird super-low or super-high numbers. I recommend using the big three: Lighthouse, Webpagetest, and GTmetrix. Find and document the results. Sort them by what is easiest-hardest to implement. Immediately draft a preliminary plan to fix low hanging fruit.
- Add defer (to your own files) and async (to external files) attributes to all Javascript files that get loaded on your site. While you’re at it, asynchronously load your CSS file(s). Make sure this happens in the <head> section to give the browser quick knowledge about the CSS resource.
- For webfonts, use only WOFF2 and WOFF formats if you do not know with absolutely certainty that your site needs to cater to TTF/OTF/EOT font users. For those users, instead consider letting them use a system fallback font which makes sense so you can get rid of the very heavy, legacy formats. You can preload fonts as well, but be wary about potentially increased load time as a result of this.
- Optimize your images. Clone your project repo (or just copy your project) and run all of your image assets in a drag-and-drop GUI tool like Imageoptim to get a more or less immediate idea of how much you could save on images alone. Think about how to integrate image optimization in your project. Command-line? GUI tool? Image-compression-and-hosting-as-a-service? There is a way to deliver optimized images, no matter how you and/or your content editors work with them right now.
- With the first ones checked off the list, start using and learning a build tool like Webpack (read: in-depth beginner article at Medium, official docs) or Gulp (Stefan’s guide was what got me into Gulp) to optimize your code. Begin with staples like minification and concatenation/bundling before going to any more complex stuff. Learn their differences, regardless of your choice. Consider a framework-agnostic boilerplate/architecture such as Hiperf, or set up a basic project with zero-config tools like Poi or Parcel. Do a guerilla project to use your project code with the build tool. Try it, fail, learn, and weep with rapturous joy when you see what wonders a build tool can do.
Finally, discuss and champion the following two items with your architects or backend people:
- Serve exclusively from HTTPS, and use HTTP2. If you already haven’t, your site is soon going to have major Google trouble if you’re not on HTTPS.
- Host your site/app on a CDN. I’m totally in love with Netlify which is free, works extremely well (offering CDN, HTTP2, SSL), is super fast, and doesn’t care a bit if the hosted site is commercial or not.
With these done, including the work in familiarizing yourself with a build tool, you have likely shaved a considerable amount of resources, bytes and user aggravation from your site or app. Do the same tests again and see what the improvements have earned you, and continue from there.
Ending Crap Performance is Everyone’s Responsibility
With this article I hope to have given you a sense of the breadth of options you have when optimizing your site or app. For some, the amount of items could be overwhelming. Let me come back to a few pointers so we can keep all of this level-headed:
- Performance is easy to overthink, so don’t make it harder than it is (it’s not so hard). On a poorly performing site, the bulk of your improvements will be made with simple means. There is a threshold after which performance gains become much harder to count home. However, at that point you will probably know well if you are in for a bigger rehaul or if you are limited by technical performance chops. You will probably already have a pretty fast site/app at that point as well, which really should be the central issue. So if performance WAS an afterthought, it’s definitely possible to fix.
- Performance is easier to work with if there are clear targets. List acceptable minimum browser support and corresponding scaling/fallbacks, set metric score targets, and understand what metrics make sense for your project and prioritize them. Browser support is becoming less of an issue now that all the big ones are evergreen and that base technologies like HTML5 and CSS3 have been fairly solid for years. Many performance improvements will “gracefully degrade” or use a fallback if support is not available, so dare to aim high. As always, test, but afford not to be too conservative.
- Performance cannot be a one-man show, at least for long. It has to be a sustained team effort with wide reach: from UX to business, from development to technical architecture. Performance should not be an after-thought.
And that concludes this article. Thanks for reading! I sincerely hope that I have managed to give you something to add to your toolbox, whether a tool, method, idea or question. Together we can make the web a better, faster place for everyone—we can set lower barriers of entry on usage, allow more people to use the web, and also set higher expectations on our own skills and the teams we work with to deliver value and experiences that users love. Again, feel free to use or study Hiperf which contains many of the improvements and recommendations featured in this article if you want to see a real-world example of much of the above.
Let’s not make another slow page or app again, OK? Pinky promise?
Mikael Vesavuori is a Technical Designer at Humblebee, a digital product and service studio based in Gothenburg, Sweden. Humblebee has worked with clients such as Volvo (Cars, Trucks, Construction Equipment), Hultafors Group, SKF, Mölnlycke Health Care, and Stena. Our design sprint-based approach and cutting-edge technical platform lets us build what’s needed.