Strategies for quantitative UX: From concepts to implementation
A technical design perspective from 😭 to ❤️ via 🧲 🗃 🧠 ⛏ 🔮

User Experience (UX) is a broad term that is thankfully gaining more and more of a foothold. Those working within UX have assembled a great deal of methods and tools to work from research to implementation, with the end goal of delivering experiences that are valued and (I dare say) positive for users. For this, both qualitative and quantitative tools are required.
UX is not just contingent on the “soft skills” and methods that are so visible on LinkedIn, those infamous posts that end up in displaying the UX process as a never-ending series of whiteboard scribbling and post-it explosions. While the qualitative processes are likely the most visible—and perhaps also one of the big reasons why people go into the UX profession at all—from the technical side those are less “easy” to work with. What we can help with, with relative ease, is within the sometimes unclear area of quantitative or rel="nofollow noopener" target="_blank">https://github.com/mikaelvesavuori/demo-app-quantitative-ux.
Some set of guiding principles.
For any quantitative UX we need to be in sync from technical implementation to business needs
Clearly divide the workload and have an action plan for how tech, UX and business collaborates on data collection and UX process enablement. Enabling quantitative UX will take a bit of time, and is therefore a business cost. Make sure to have that dialog!
Quantitative or qualitative?
You need to know when to use qualitative or quantitative methods. Rough baseline would be to lay a technical foundation for quant early, but not actually use it until there is meaningful traffic, such as a semi-public alpha or beta. Until then, resolve to using qualitative methods.
Business requirements vs UX: which comes first? Do they co-exist?
They should be co-dependent! Something I do see quite a lot is that business requirements can tend to prescribe the how which can be scary. UX should be able to find that angle based on a higher-level requirement. Then there’s the whole thing where a part of the ongoing online conversation is about claiming everyone is a designer (you will get no opinion on that here), but there should absolutely be some clear-cut barriers where what, how, why, when, who etc. are asked and segmented and driven clearly within distinct business domains (UX here, business there…). So, the higher up the chain, the higher the degree of abstraction should be. UX is not at the top but should support the business layer.
What are some KPIs?
Typical metrics could be:
- Movement and navigation patterns
- Task completion
- User errors
- Time spent doing task
Obviously there is no God-given truth to how those metrics need to look for you to know that your product is amazing or awful randomware. That’s where you need people to infer facts from data, validate the data, and follow up on data with other methods. At some point you will need to find some value to compare against, even if just historical, such as seeing that a value is increasing or decreasing over time.
Insights should shape actions
Don’ t just gobble up insights, use them. As someone who has seen many projects unnecessarily go the waterfall way, this is likely the biggest breaking point. If you can’t manage to change as you go, based on input, then you are pretty much doomed from a UX perspective.
Concepts
It’s probably in line to give comments on some common terms in this area. Here’s a list of some of them. Don’t expect the Oxford Handbook of Absolute Truth in Data here, though!
Data collection
Also known as ”tracking”. To have data, we must collect it. We can do it through a range of tools. What and how much they gather is also variable depending on the tool, and how custom it is.
Data processing
This is what it’s called when we do something with the data. Being a data processor is privileged work and something you sign long contracts about, for example with Google Analytics. No small deal, and very important to do right if we process other peoples’ information.
Data access
To do something with data we need to have access to it. This goes hand-in-hand with data location since they combine to define how we can put data together.
Data location
Where data is stored matters for many reasons, chief of which is legal concerns. This also impacts how we can work with, and massage, data in a speedy fashion. Some services make it impossible to pull out data into a reusable form. Correct architecture for ingest and digest is critical.
PII (personally identifiable information)
Some pieces of information are more private than others. Often, it’s not the individual bits that matter as much as groupings of things that, combined, will give a very personal or private picture. This type of data is very, very sensitive and must be handled appropriately and securely.
Anonymity
It is possible to retain a degree of anonymity even while one’s data is being collected. Sometimes there is direct functionality (like in Google Analytics) to make sure only anonymous data is harvested.
Consent (explicit)
Under GDPR and other laws, pretty much all data collection must be explicitly agreed with. With explicit, the laws stipulate that one knowingly understands what is being consented to, and that it’s reversible. You must always default to opt-in rather than opt-out behaviors.
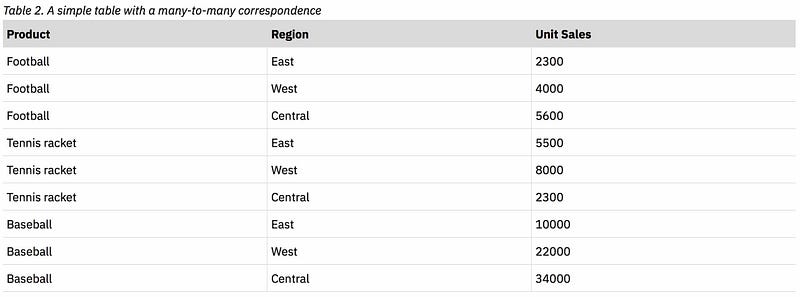
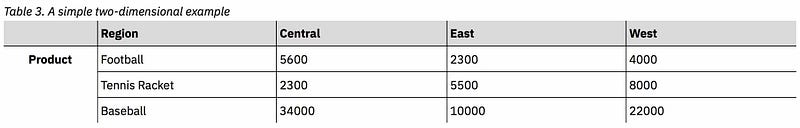
Unidimensional vs multi-dimensional data
Data with one dimension is just a key-value pair. You see direct relationships and won’t find many surprises here. With multi-dimensional data, you can cluster any number of properties/values under one given key. This allows for more complex data, and much harder work to decipher.
The right tool and strategy for the job
Quantitative UX will be about more than just deploying one given tool, it’ll require several. Based on your exact needs and the current stage of the project, there will be certain considerations that will need to be made regarding what tooling is required.
I’ve made a demo package on GitHub which showcases a few of these things. Screenshots will be from this same code, which ran against my test environment in Google Analytics and any other products mentioned. It features:
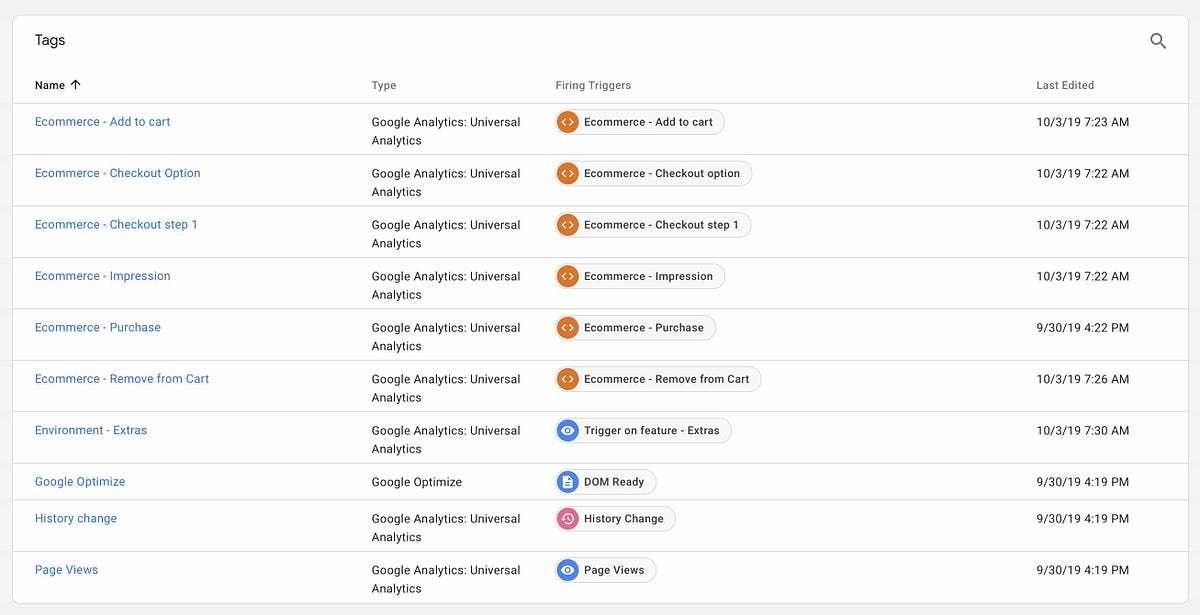
- Google Tag Manager using Enchanced Ecommerce (checkout, add, remove, impressions, purchase)
- Google Analytics and Google Optimize activated through GTM
- Split.io for feature toggling
- Netlify for hosting and split-testing functionality
To the above set I will also mention in text a few additional ones, such as KPI documents; “data pipelines” (writing your own live clickstream events—essentially just like GA/GTM—to cloud storage); and Google Data Studio.
KPI document
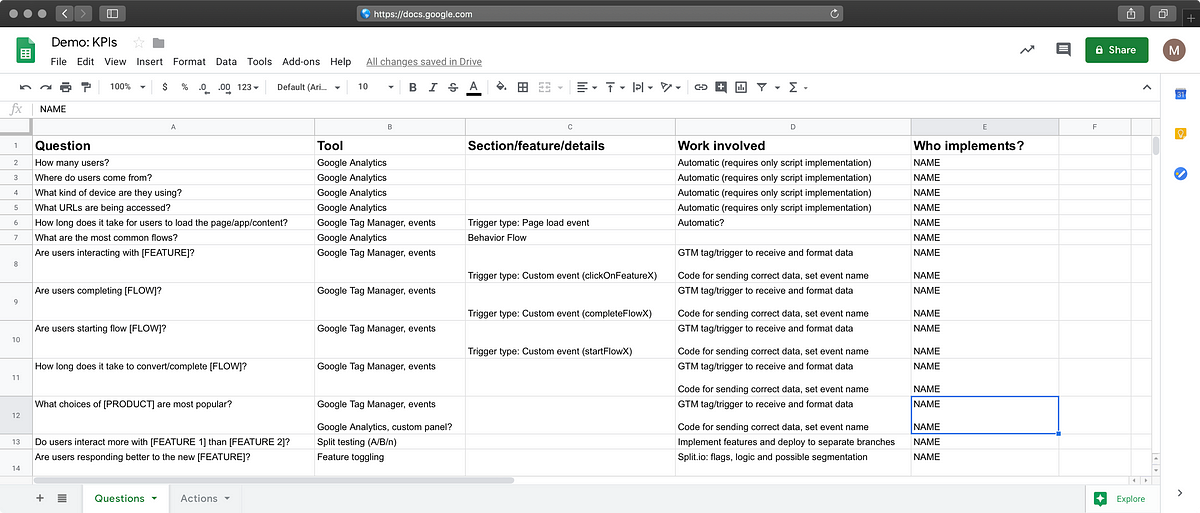
Have a centralized resource for your KPIs. Smarter people than me may have a different way of doing this, but I think it makes sense to break a KPI down into questions and actions.
The questions sheet displays each question your team wants to know—for instance, Are users completing flow [some important flow]?—together with specs on the tool and work involved. I’ve seen even in very small projects that uncertainty around the practicals will totally kill any implementation. This is at least one way of getting around that problem.
Some sample Key Performance Indicators could be:
- How many users?
- Where do users come from?
- What kind of device are they using?
- What URLs are being accessed?
- How long does it take for users to load the page/app/content?
- What are the most common flows?
- Are users interacting with [FEATURE]?
- Are users completing [FLOW]?
- Are users starting flow [FLOW]?
- How long does it take to convert/complete [FLOW]?
- What choices of [PRODUCT] are most popular?
- Do users interact more with [FEATURE 1] than [FEATURE 2]?
- Are users responding better to the new [FEATURE]?
My next proposal may for some be a bit too solution-oriented: Have an actions sheet where you collect and outline any actions that should be taken on KPIs/questions in the other sheet. I find this to be a natural progression of keeping business logic together with the business/UX questions we are asking. For instance, if we ask what products are important for customers, then we will at some point know that. Because we have gained that “knowledge”, we can make informed decisions based on that. Given the case that a business requirement would be to more aggressively drive campaigns towards customers who are “window shoppers”, then this sheet is where that would be documented. Ergo, we have:
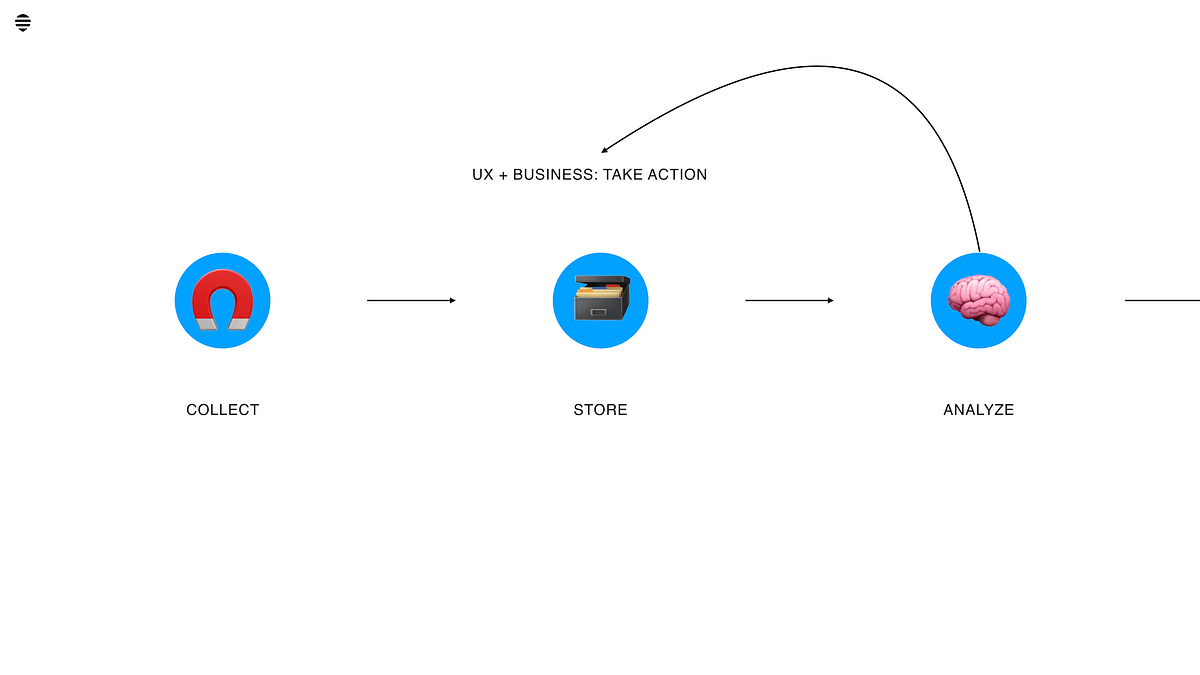
- Documentation: Asked KPI-relating questions which are documented and agreed upon by key stakeholder
- Implementation: Data is collected as per those questions
- Analytics: In Google Analytics (etc.) we can see historical data on those questions
- Action: We can finally take action based on business requirement and existing data
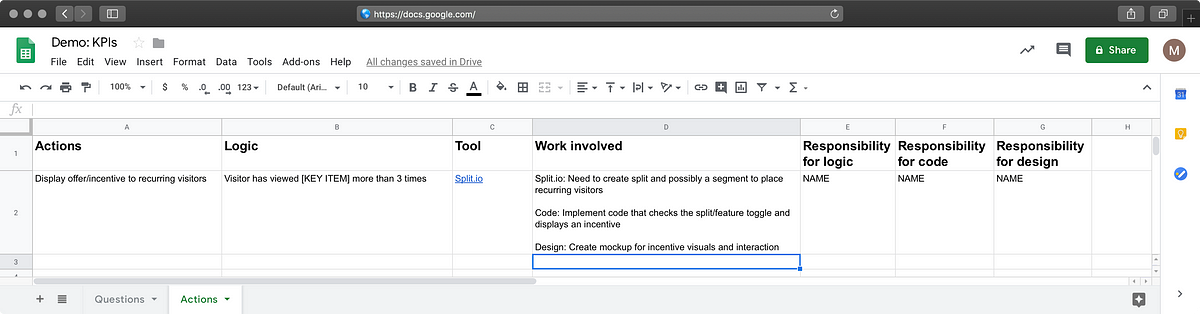
A few example actions might be:
- Display offer/incentive to recurring visitors
- Personalize content flow based on previous interests
- Help or direct-contact prompts if user is spending a lot of time in a specific decision point
Google Tag Manager
For the longest of times I didn’t really see the reason to use Google Tag Manager rather than a straight, no-fuss implementation of Google Analytics. Then the light of data hit me strong as being under the strobe light of a UFO.
Think of it this way: Google Tag Manager is a complete package solution, whereas Google Analytics—from a user perspective—is just a small script pushing clickstream (and some other) data to Google, where you then can see that data visualized in the GA dashboards.
With GTM you get a centralized hub that allows you to configure and manage your containers, a concept that here relates to the parameters and settings that are to be packaged together. That makes it possible to roll out a similar setup of parameters for any other number of sites/apps, which becomes tedious and damn-near impossible with a vanilla, full-manual GA setup. With containers you also gain version control and documentation, so a more collaborative workload becomes easier. The workflow is also safer as you can rollback to previous versions.
You should view Google Tag Manager as the master integration interface for any auxiliary services, like Google Analytics and Google Optimize. It’s a straight-forward thing to connect those, and other, services to your GTM property. Therefore, in the actual code implementation you would not normally insert snippets to load code for any of those services (if not directly prompted by GTM) but you’d rely on Tag Manager to do its own setup for you.
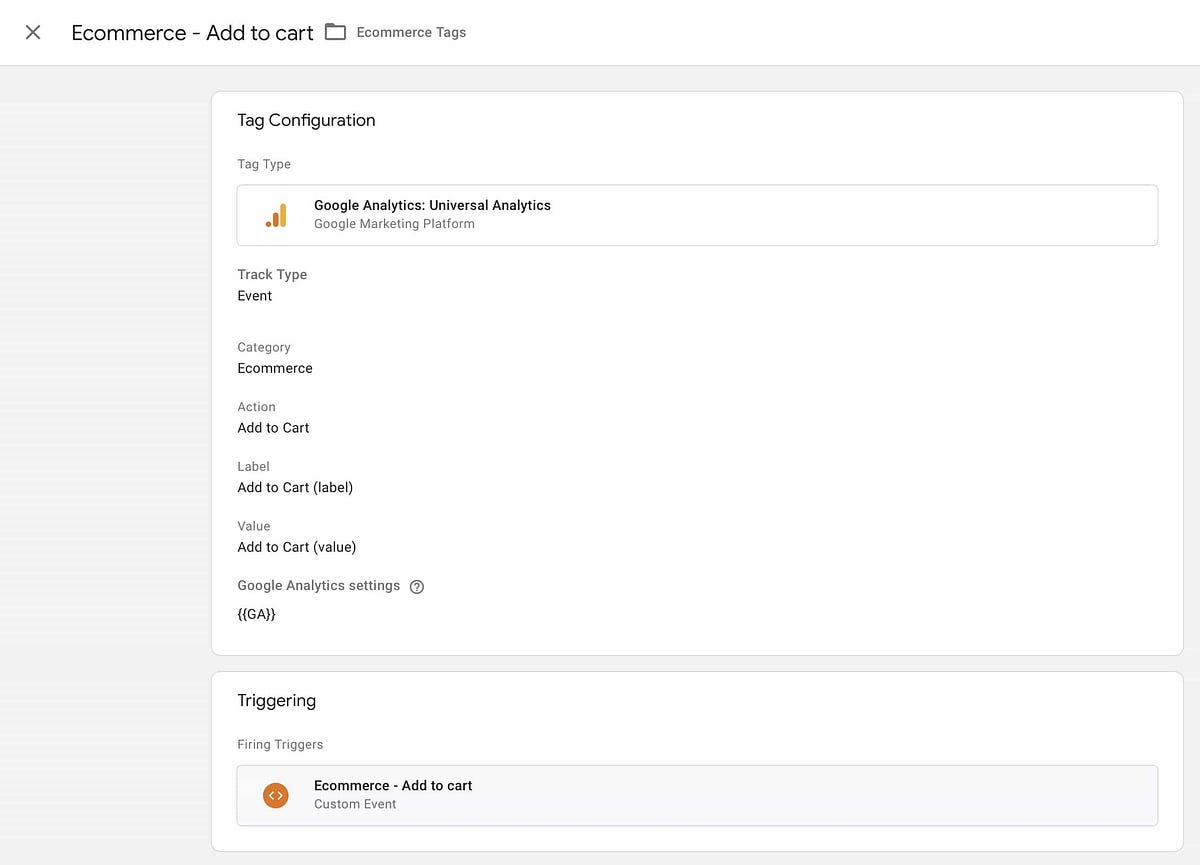
The operative concept in GTM is tag, which is a snippet of code. I like to think of the key concepts in this way:
- Tag: The description, data shape, or just even this is the thing…
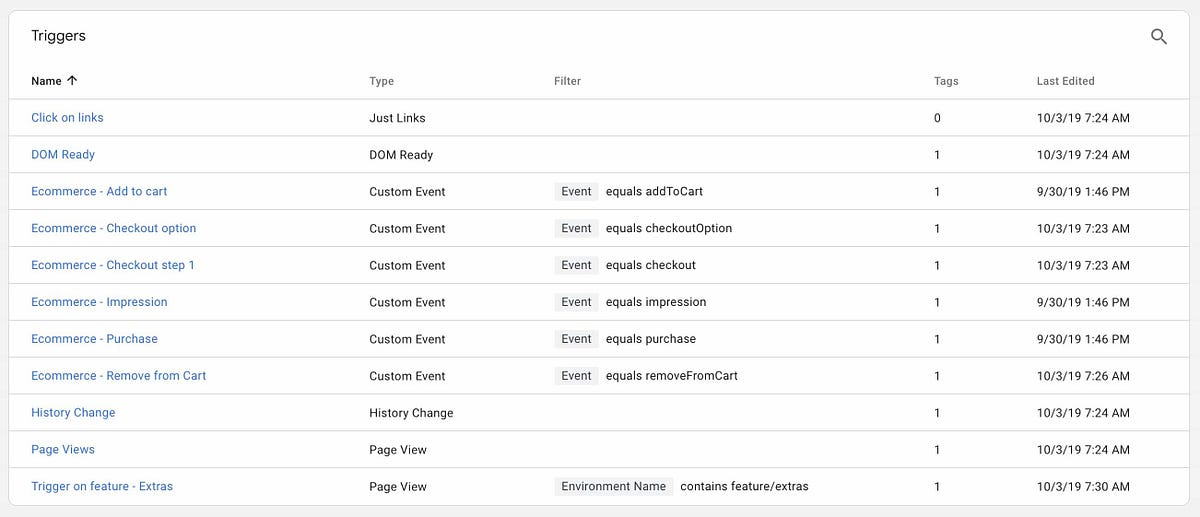
- Trigger: …because this happened on the client
- Event: The primary tracking type. In a reactive application, you will use events more than anything else in my experience. Basically, the bit about how this is handled
The takeaway is that the combo of tag + trigger is a kind of contract that binds all of the GTM magic together.
An interesting insight struck me early on as I was burrowing deeper into GTM, though. Since the management in GTM is not strictly required in a plain-vanilla GA approach, the actual time to implement will increase, if not over years, then absolutely over the short term. With pure GA you would just find your relevant code segment, augment it to for example send a product click event, and be done with it. Done deal! Problem is, that this convenience is completely linear and has no contract end (remember that term from just a paragraph up the page?). Using GTM, you’d first wire up that event in the GTM panels—essentially creating such a contract, which also just happens to be somewhat human-readable and in a format that’s not code—and then just tell the event key in the datalayer that yes, indeed you want this to be the “purchase” event (or whatever nomenclature you are going for).
GTM allows site owners to also fire automatic events on certain key events, like an element being fully loaded. This makes GTM a bit more powerful feature-wise, and for me this is a boon and a curse. Good thing: you do not have to do all kinds of boilerplate sending of data on pageload complete or similar. Really bad thing: super easy to handle poorly and thus overloading the page with requests, which means radically decreasing the user experience.
The absolute worst is yet to come: that you could use GTM as a black hole to suck in and present any given number of third-party scripts. 😱 💥 💀
If you’ve ever encountered super-slow sites that still manage to look like they at least should have been slick as a seal, well, then chances are that an overzealous marketer stuck all the scripts they could lay their hands on, and put them through the 🕳GTM black hole 🕳. I’m not old enough to say I have multiple decades of experience, but in every big-name company I’ve worked at/for, this has been a problem at some point. It is manifested through digging through network traces and the entire code base to understand 😡 where the hell is the code coming from! 😡 To be completely fair, this would be a case of poor usage and misunderstanding what goes into GTM and what goes into some kind of regular, maintained code. Still, the potential exists and is widely misunderstood.
To summarize: You should probably look into GTM, but do not expect this to be your one-stop shop.
There is also a pervasive notion floating around that you do not need to code any more, if you use GTM. This is simply not true.
Beyond inserting the script in your code, you will probably need to update a number of events that still need to actually send data to GA/GTM. While your mileage may vary on how “little” you need to code, this factor should definitely be what drives a decision or even plain old curiosity around Google Tag Manager. Instead, see it as a solid, understandable way of creating the event contracts and letting them be agnostic to any given site/app/implementation, and that you get the interface, version control and necessary code glue for free. That’s a very good deal, I’d say!
Google Analytics for data processing
As I wrote about earlier, Google Analytics is the OG of data collection and visualization. With that said, it’s also really no more complex than a set of dashboards to show your data.
You get a number of nice features out-of-the-box, like being able to follow live events and any time you hook something to GA you also immediately get a lot of extra information like user location, browser, device type and so on. No extra work needed. If for nothing else, this is the type of extra value that makes GA a must-have even if you were not doing any other UX work.
If you use GTM to funnel data here, it should hopefully already be meaningfully grouped as per your events (with categories, labels, etc.). Dashboards and views can be customized for your needs since no one-size-fits-all exists. I’d still argue that the starting panels give a fair bit of overview.
With only a bit of additional work it’s also possible to use the Enhanced Ecommerce features, meaning you can for example follow purchasing funnels, product impressions and directly access sales data. With the help of some creative hacking, you could probably use those features for similar but non-monetary tracking purposes if you are doing a service which itself may not contain any transactions.
All in all, many good people have written literal books on this subject. This is where you’d tuck in the data people or your numbers-oriented UX folks. As opposed to Google Tag Manager (which is the starting interface), Google Analytics should be the end destination in a conventional data setup. Unless you want to do something more manual, as I describe briefly under the BigQuery and Data Studio sections.
Google Optimize
When it comes to very minute (in the big scope of things) optimizations, such as content (image and text), disposition or minor changes in interactive elements, then Google Optimize is your buddy. Use Chrome when using it, or it will complain, and add the Chrome extension. No cost attached! Then you’re ready to go.
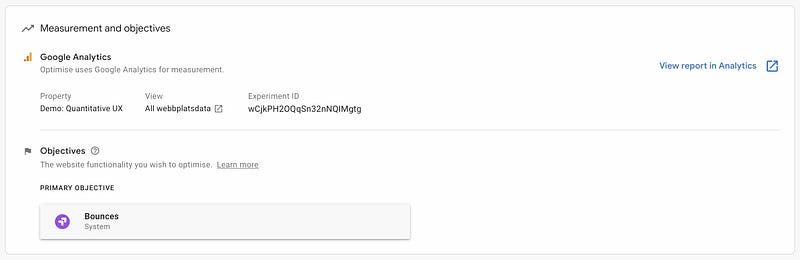
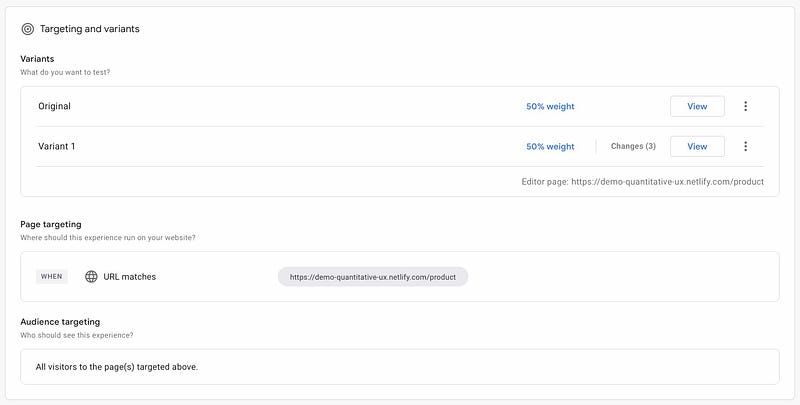
It’s all as easy as hooking up your site to Optimize, set your objectives (for example more/less page bounces) and make changes in a fancy WYSIWYG overlay. Then save changes to a version and split the traffic.
As your experiment is ongoing, you can view results of the usage. It should be possible for you to get a fairly immediate sense of how your goals managed to do in your testing timeframe as opposed to a timeframe without those changes. Feeling finished? Then close the experiment and you get the results saved inside the service.
Again, the reason you’d want to use Optimize is because you want to do changes that need to be rolled out without any coding involved. Precisely as an effect of that, I’d argue against doing anything that would best be done with a regular, considered code edit. The power of Optimize is that the effort of change is near-zero, but with that power comes responsibility. I’d strongly advise also to make sure that any rollouts of Optimize-originating changes are clearly communicated to other teams (marketing? brand? content? developers?) or they’ll go crazy trying to find out where THAT change is coming from.
Sounds like magic? Here’s a bunch of how-to videos that will hopefully convince you there is no magic involved.
A/B/n or split-testing (Netlify; AWS/Google/Azure…)
It’s common to hear that “we should do more A/B testing”. I’ve always found it curious and kind of stingy that you’d only ever show two distinct versions, and then at a fairly high operational cost. That’s why we got the lovely A/B/n denotation as there should be no theoretical maximum of the quantity of variations we should be able to run. Split-testing is just another repackaging of the A/B testing concept. Let’s move on.
Many of the products and services I’ve built have been architected around a JAMstack-type tech stack (Javascript APIs Markup). I’ve also been a big-time user of Netlify since at least 2016, since it makes a complete ops moron into an absolute wizard with continuous integration/deployment, near-magic instant cache invalidation when updating code, global multi-vendor CDN and beautiful integration with Bitbucket and Github. Netlify brings a ton of niceties to the operations table, split testing being one of those things. Implementing split testing on Netlify is incredibly easy and requires only that you have more than a single branch.
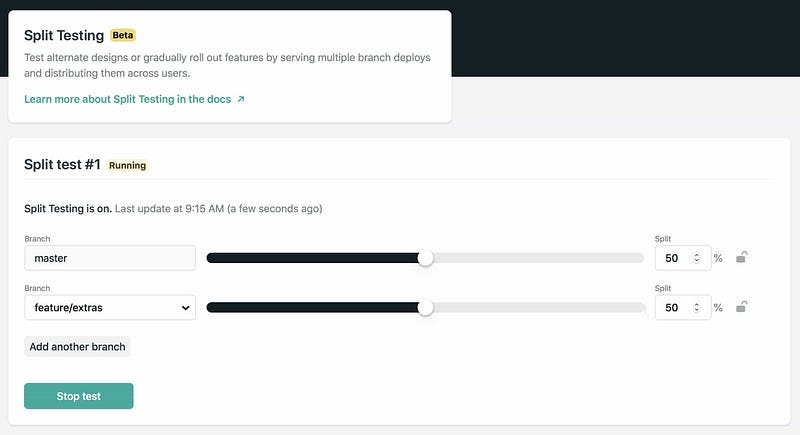
If you use Netlify, you should try the split testing capability. After you’ve cleared your mind and wiped away that couple of seconds of disbelief where you thought “wow that just cannot have been that easy!?”, go and tell your Product Managers and UX people that “hey people, we should start doing split testing. Like…today”. Do it.
If you are NOT using Netlify, you may be using one of the big public clouds like AWS, Google, or Azure. Operationally it can be a bit of a hassle to do A/B/n testing but given a reasonably modern cloud setup, this is going to be somewhat easy (but probably nowhere near as easy as with Netlify *wink*). Because of the varying ways in which this could take shape I will simply add some of those methods:
- Google App Engine supports traffic shifting from the box
- I don’t know very much about this, but Google Firebase should support A/B testing as well
- AWS Route53 can handle traffic shifting if you are using it for your domains and CloudFront
- Azure Traffic Manager should be able to do similar things
- Google HTTPS Load Balancer with instance groups should definitely be able to do blue-green deployments
- Kubernetes does blue-green like no thing at all
- While I personally like the “rawness” of keeping only the latest function when using Google Cloud Functions, at least AWS Lambda can have multiple versions and thus make use of blue-green deployment patterns
Note that while concepts like A/B, A/B/n, canary releases and blue/green deployments all are a bit divergent from each other, they all imply having more than one version of code public and live.
A smart thing to do is to ensure that any analytics data you capture also knows what version of a page the user is browsing. That may be evident from a URL or that they are using a feature which is walled behind a certain version, but never trust your cunning and logic to survive multiple testing rounds and overlapping data. Do add the version info to your every analytics push.
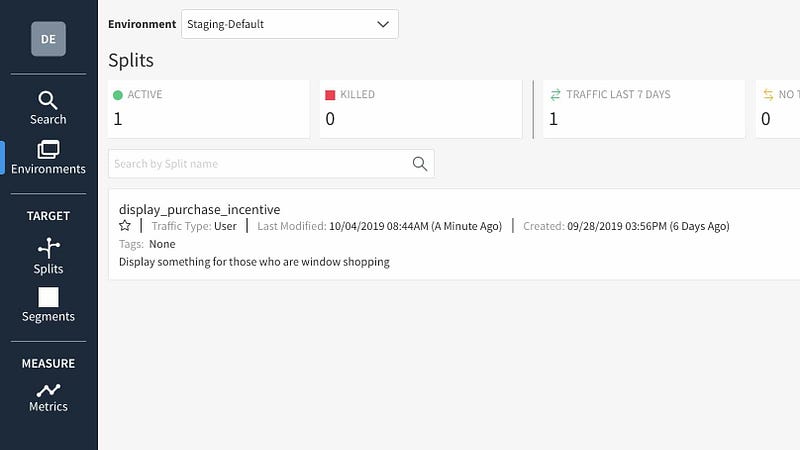
Feature toggles (Split.io/Optimizely Rollouts)
Really, a feature toggle is no more complex than a switch that says whether something is one value or another (like, “on” or “off”). Some of the feature toggling services and libraries you may find are just that simple. Others offers advanced configuration and persistence of, for example, users and their individual settings.
You should use feature toggles if you want to support enabling business logic outside of code, but only for a short period of time.
This makes it ideal to test a new feature on a specific market, or to try promotional offers for a certain type of customer.
From an implementation perspective you will need to connect to a service—such as Split.io or Optimizely Rollouts)—and then you normally just do a regular conditional check in your code (“if/else” block) against the value you want to lookup. That way you become decoupled from the business logic gate. However, as you probably saw, you are adding logic (however small) to your application for that lookup. This is why feature toggling is decidedly an anti-pattern, which may sound antithetical. You will want to keep the total number of feature toggles very low (say 5, if you really need an arbitrary number) and keep the toggle logic in code for as little time as required and then rip it out as soon as you know how that piece of business logic should be globally handled (that is, should it stay on or off in the future?).
Because you are going to an external service, you are also creating a direct dependency to their service and its performance. In a recent large-scale project we had problems with one feature toggling service as it could not return the value of a toggle within the few seconds window we had to do edge-side prerendering of website content. Therefore you should absolutely pressure test a solution before going bananas with any service.
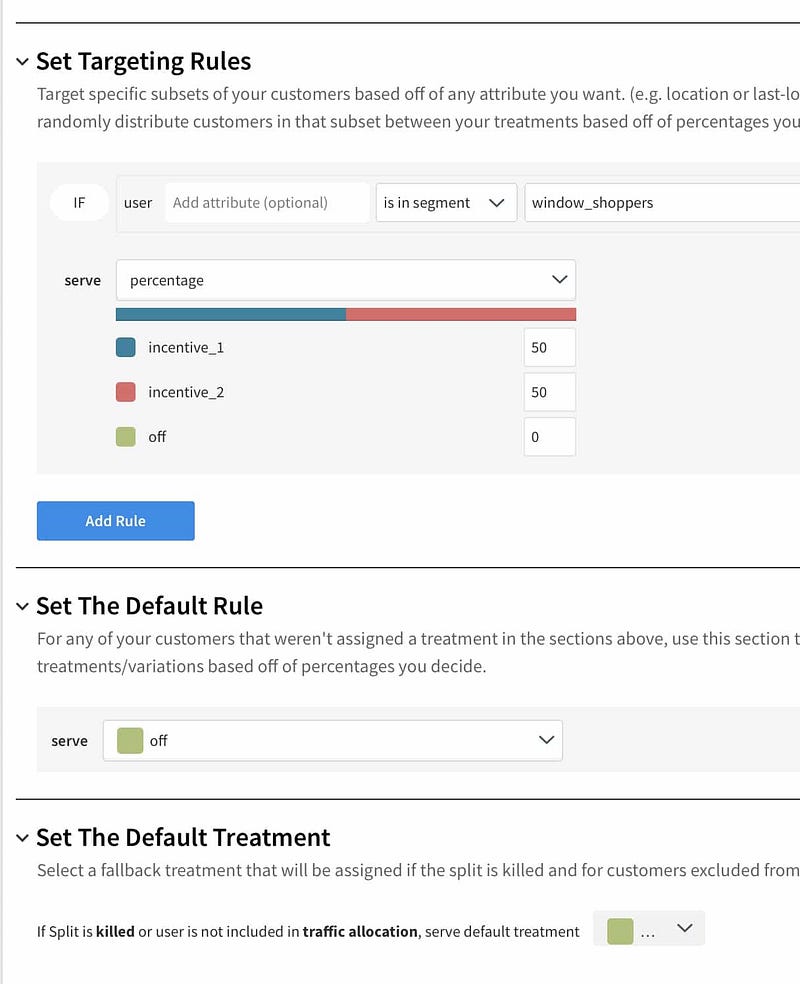
The scale of a feature toggle can be whatever makes sense from an essentially boolean perspective given a tool that a business person could use. Tools like Split.io offer (in their paid plans) also support to do relatively advanced behaviors like grouping users based on reported IDs, which would also add a further burden of having frontend (and potentially backend) tooling to support using this type of tool effectively.
My recommendation is to use a very lean, very fast tool that a non-technical user can use and not look too much on product features. Take a look at Optimizely Rollouts for a good idea of how this could work with a truly minimal, yet friendly service. Then after running it in production for a period time, see whether there is a real reason to do anything beyond simple booleans.
Custom data pipeline to BigQuery
It’s really important to own and control your company data. Never trust an individual product to ensure that that is the case for you.
The linked repository does not show how this step can be done. To mitigate that to some small degree, here’s a link to how Qubit does this for personalization and a Google Codelab using a proposed architecture to run a serverless data pipeline.
A simple, naive first draft that I’ve done a couple of times at small scale is to replicate the GTAG pattern, which means sending a JSON object with a shape similar to the one Google Analytics uses in its vanilla implementation. You should be able to offload this to something like AWS SQS or Google Cloud Pub/Sub if you want to reduce load on your database. In Google, you would probably then want to dump data into Cloud Storage by utilizing a backend server (maybe a serverless FAAS solution like Cloud Functions) that listens to the queue event and then—finally—read from it with BigQuery either by loading or streaming it when you have a reason to read the data. Best of all? You have now complete ownership of the event data, and can process it as you wish, no longer trapped by what a given product gives you.
While I am no big data wizard (yet?) I think the reasonable middle road is to collect the event or clickstream data, but also use a third-party solution for product analytics, or if you really need it, use Google Tag Manager for your common business goals. In any case, if you have a data team or dedicated BI people, they will suddenly be much nicer if you can show them that you’ve dumped data into regular, non-opinionated data warehouses/lakes instead of residing solely in a (usually expensive) product.
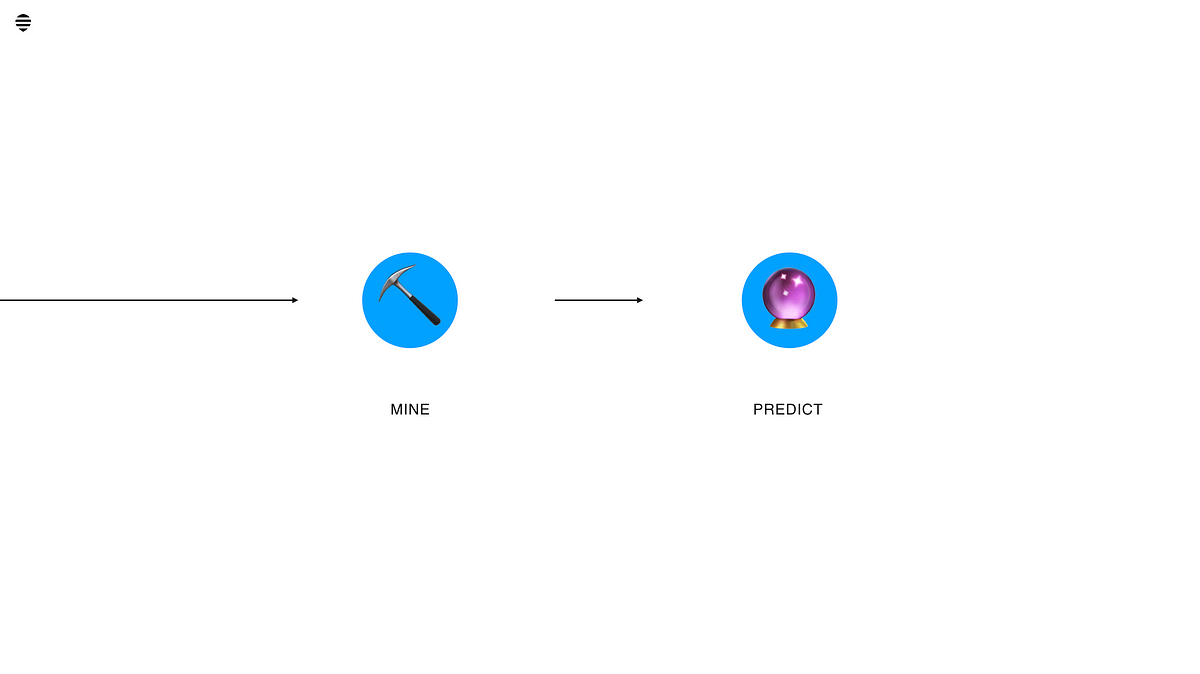
Recently BigQuery got support for native machine learning capabilities, under the name BigQueryML (BQML). This is an exciting addition that means that you can further cut down the required number of steps to do prediction based on your historical data. The need for a dedicated machine learning pipeline and expertise becomes a lot smaller if you only need to perform the more common prediction use cases.
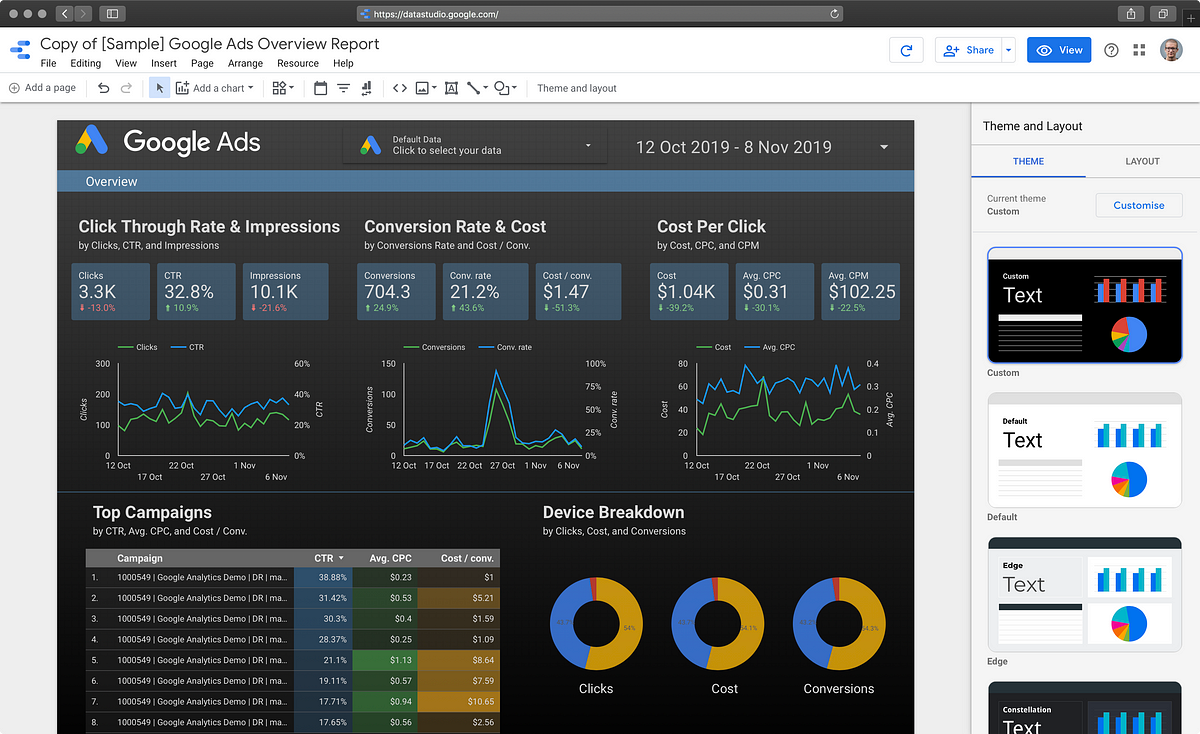
Google Data Studio: Consume and visualize BigQuery and GA data
Data Studio is one of these products that, were I within a somewhat different field, I would probably love a great deal. It offers easy ways of connecting data sources to a Powerpoint/Keynote-like board where that data can be visualized in numerous types of statistical graphs and representations. Data sources include Google Analytics and BigQuery. So basically, if you did as I suggested above and used both GA and a custom clickstream pipeline, then you could use that data here without breaking a sweat. Think I’m making big claims? Need a look-see guide? Here’s one for you.
A colleague of mine who is new to this type of tool but is highly interested in the field gave Data Studio his both thumbs up. He felt it was really intuitive and easy to work with. My verdict is also positive, however I am in no expert position here and have not spent any considerable time with it. It does give you the potential to (in theory) recreate many common tasks and dashboards you would want to see in Google Analytics, but without any specific dependency to that product. That’s a Good Thing™.
If you’re a data person you should absolutely check this offering out. It’s also free, so no need to ask that scrooge at Purchasing any questions.
Wrapping up
Now you know a bit about the nitty-gritty implementation (the salty caramel ice cream🍦) but before you get there, here’s all of the broccoli you’ve got to eat first.
Basic guardrails
- Got to have a shared understanding. To work with rel="noopener" target="_blank">the associated code repository) has given you inspiration as well as some practical guidance in how to proceed regardless of your maturity in the field. Best of luck!